
Are homeowners the same as renters?
December 15, 2025
Author: Roger Ashworth, Head of Research and Data
At a high-level, homeowners and renters behave differently under financial stress. In the following note, we evaluate how households absorb macroeconomic shocks, access liquidity, and manage repayment of obligations.
The structural differences between homeowners and renters
Data from the Federal Reserve’s Survey of Consumer Finances(1) shows that homeowners and renters operate from fundamentally different foundations. In 2022, the median net worth gap was significant: homeowners registered $396k compared to $10.4k for renters (Figure 1). The Consumer Financial Protection Bureau’s 2024 well-being survey(2) further indicates that renters score materially lower on financial well-being metrics (roughly 9 points lower) and report a shorter capacity to absorb unexpected expenses. As a result, renters begin an economic cycle with less liquidity, less cushion, and weaker access to credit. Homeowners, even when cash-constrained, benefit from holding an illiquid but potentially stabilizing assets.
Figure 1: Federal Reserve, median US family net worth and income, homeowner vs renter/other, 2019 and 2022
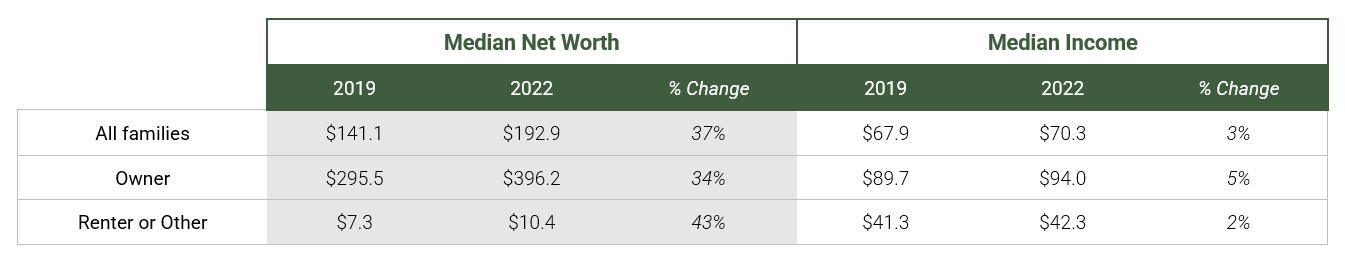
Source: Federal Reserve.
Effects of macro shock
These structural differences produce asymmetric exposure to macroeconomic conditions. For example, renters experience housing inflation directly as leases typically reprice annually. By contrast, mortgage borrowers face less payment adjustments as only ~4.1% of outstanding mortgages are adjustable-rate as of Q2 2025.(3) Correspondingly, non-housing delinquency rates among renters tend to be higher. In a recent FEDS note, the Federal Reserve highlights that auto loan and credit card delinquency rates tend to be higher for renters.(4)
Figure 2: Non-housing delinquency rate by homeowner status
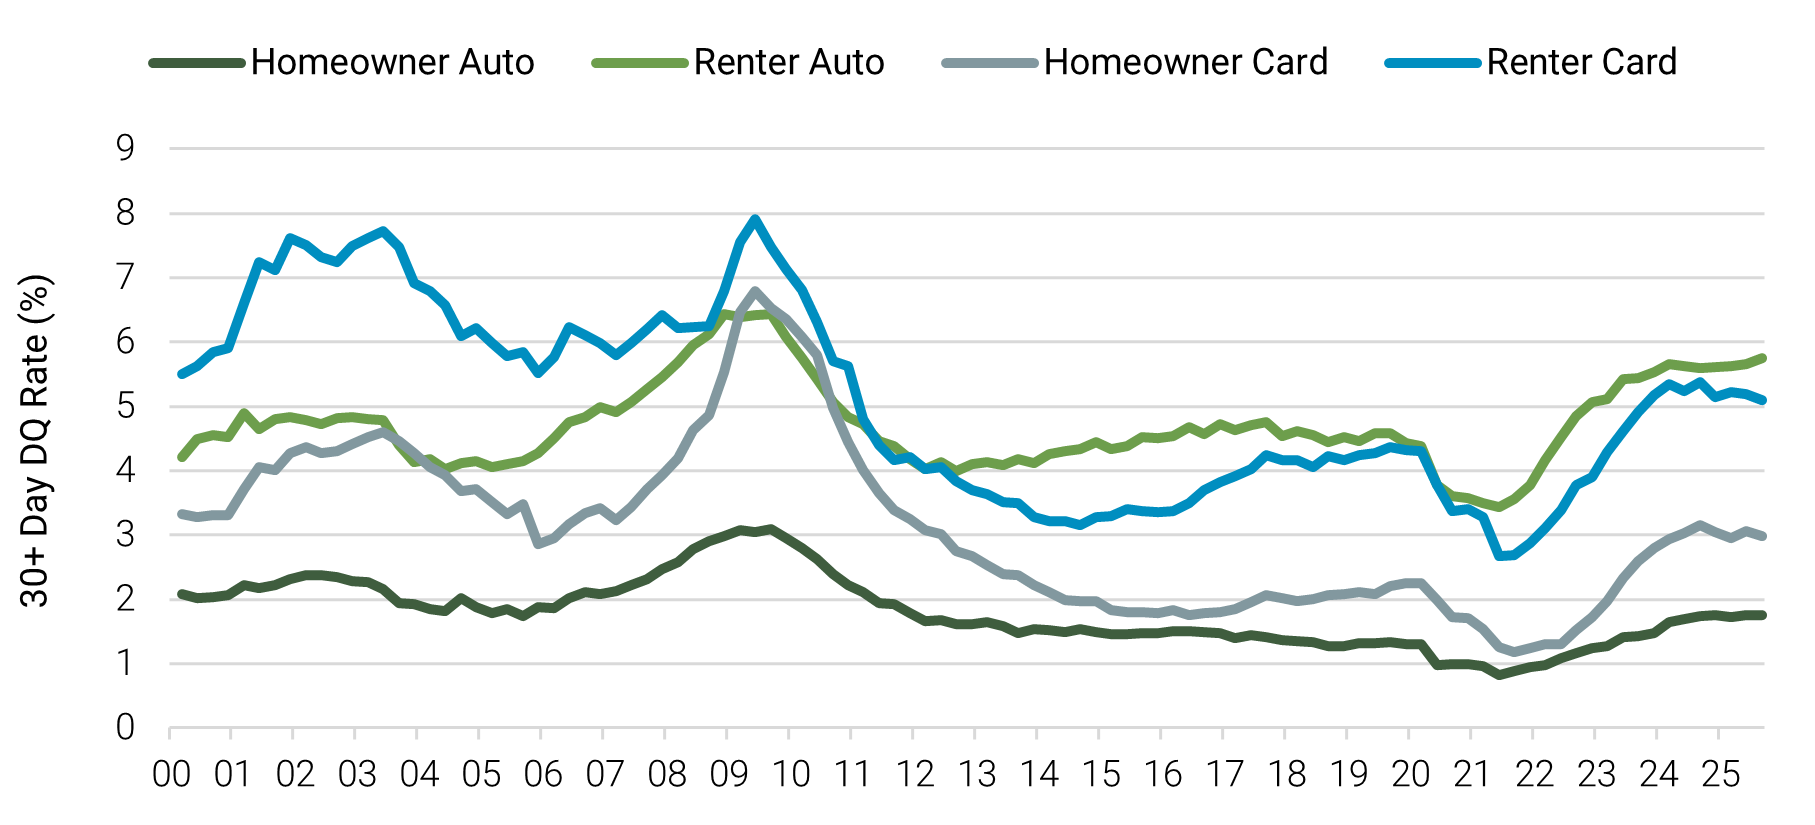
Source: Federal Reserve.
Behavioral Differences
JPMorgan Chase & Co.(5) shows that homeowners exhibit a positive marginal propensity to consume (MPC) out of housing wealth, especially when credit constrained. When home values rise or tappable equity increases, many owners increase their spending. Renters do not share the same benefit. This creates a behavioral wedge where owners behave more pro-cyclically with respect to home and asset prices, while renters behave as if they have no exposure to those asset dynamics.
Additionally, Liberty Street Economics(6) emphasizes not only whether households default on obligations, but which obligations they choose to forgo under stress (Figure 3). Since 2011, mortgage debt payment has risen, peaking around 2020 and remaining elevated relative to auto and credit card loans. With rising home values and higher interest rates—paired with widespread low fixed-rate mortgages—homeowners have more equity at stake and thus stronger incentives to stay current on their mortgage payments. The prioritization index reflects how US households have become increasingly disciplined in which they repay debts: mortgages are paid first to protect a large asset.
Figure 3: Debt prioritization over time
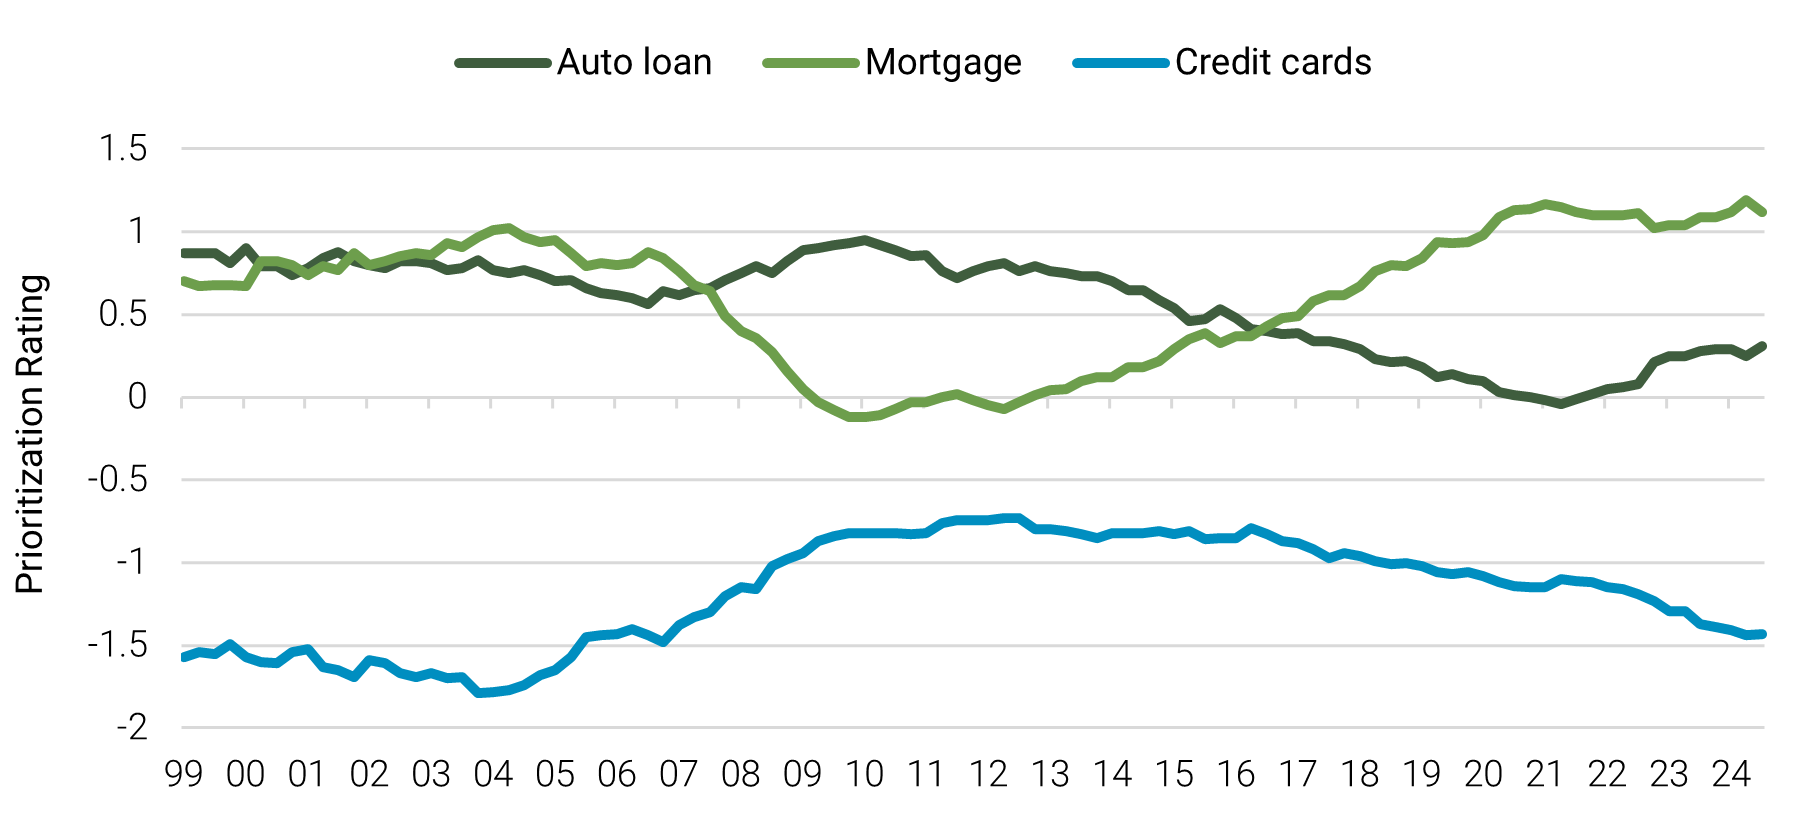
Source: Federal Reserve, Liberty Street Economics.
If homeowners choose to tap their equity, how much is there and how do they monetize it?
In their latest report on home equity trends, TransUnion(7) estimates that US homeowners hold approximately ~$21.8 trillion of tappable home equity, the majority of which resides with the highest credit quality borrowers (Figure 4). These strong credit home owners may look to a second-lien solution since most already have low first mortgage rates (Figure 5). This could take the form of a fixed rate mortgage or a home equity line of credit (HELOC) which can be re-paid and re-drawn over a defined period, after which the loan amortizes to maturity.
For more credit-challenged homeowners who may not qualify for a traditional mortgage, newer ways to access their home equity have emerged in recent years. One of which is a home equity agreement (HEA), where an equity-rich borrower can obtain upfront cash by selling a share of their future home-value appreciation to an investor. Unlike traditional mortgages, these agreements generally do not require monthly interest or principal payments, with repayment occurring up on sale of the property or at contract maturity.
Figure 4: Tappable home equity stands at $21.8 trillion currently
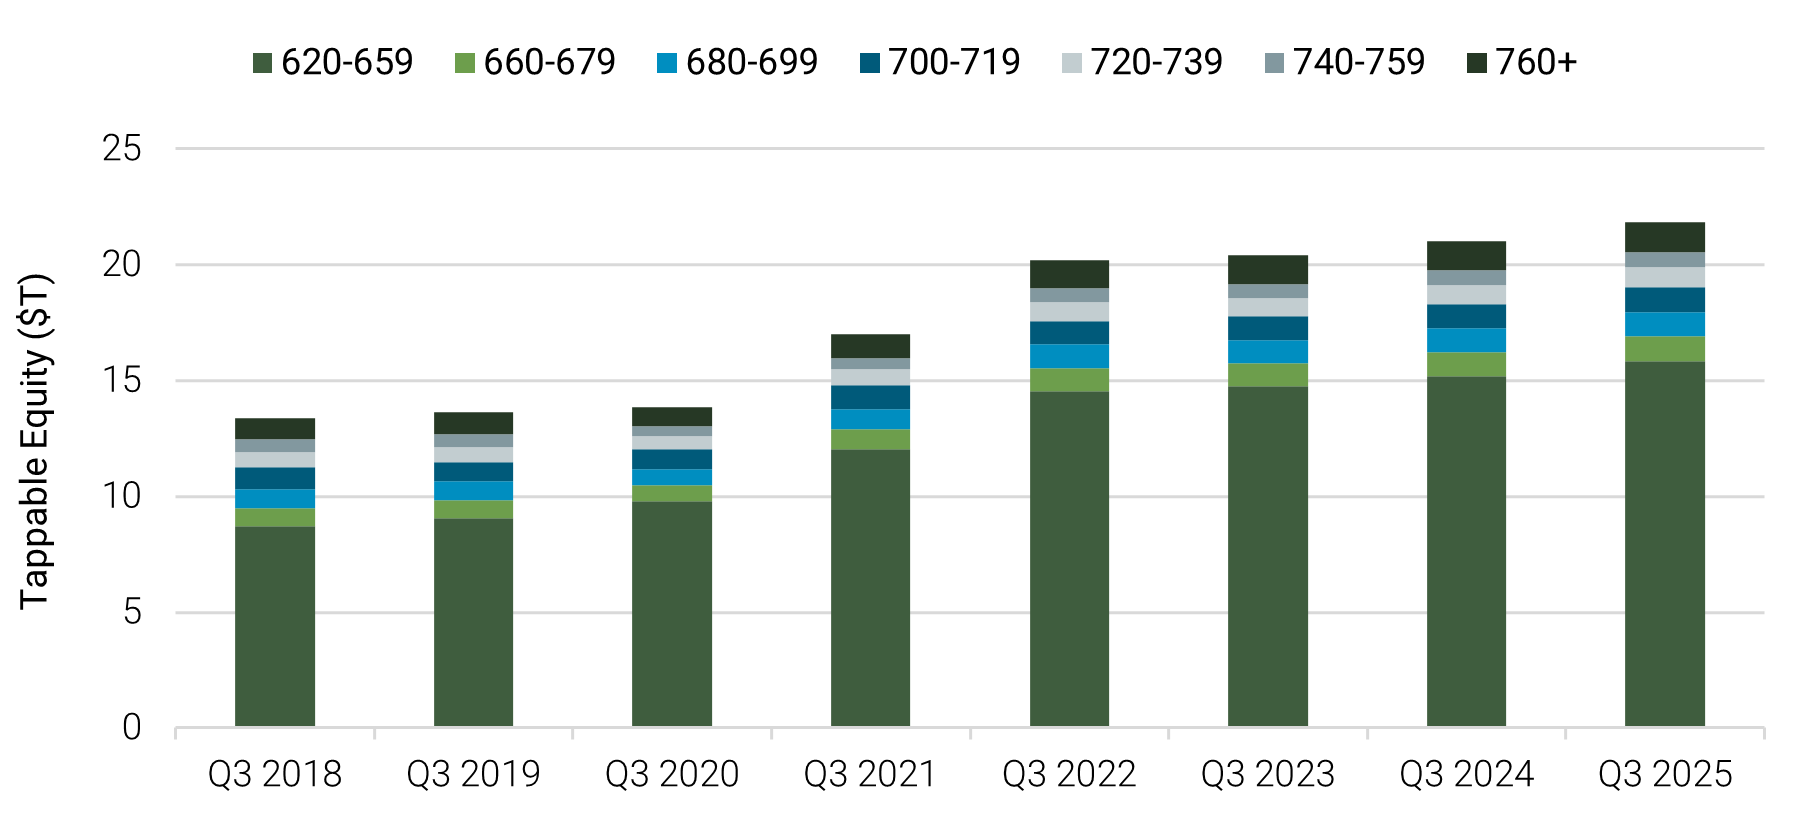
Source: TransUnion.
Figure 5: While the average national outstanding mortgage rate is 4.3%, many homeowners have lower (% of total by balance)
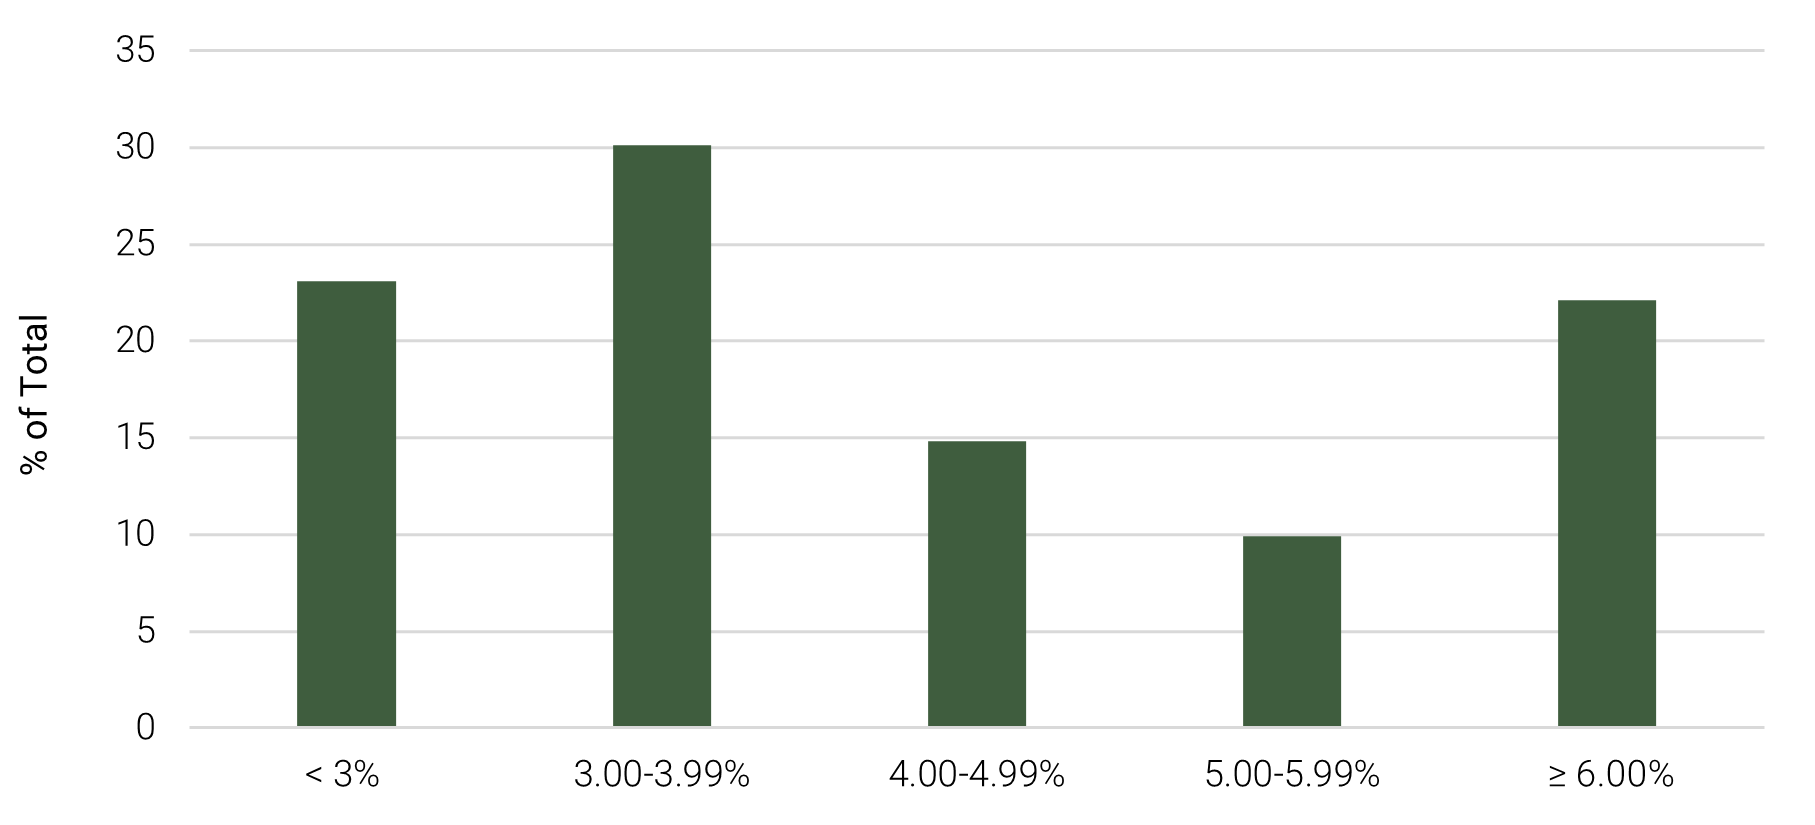
Source: FHFA.
The bottom line
Taken together, these patterns illustrate that homeowners and renters are not economically equivalent populations. They differ structurally in wealth, exposure to inflation, access to liquidity, consumption responses, and repayment hierarchies.
Footnotes:
(1) Federal Reserve Board of Publication, Changes in US Family Finances from 2019 to 2022, Published October 2023.
(2) Consumer Financial Protection Bureau, Making Ends Meet in 2024, Published November 2024.
(3) FHFA, Outstanding Residential Mortgage Statistics Summary, Data as of Q2 2025.
(4) Federal Reserve, A Note on Recent Dynamics of Consumer Delinquency Rates, Published November 2025.
(5) JP Morgan, The Housing Wealth Effect in the Post-Great Recession Period, Published June 2020.
(6) Liberty Street Economics, When the Household Pie Shrinks, Who Gets Their Slice? Publsihed March 2025.
(7) TransUnion, Q3 2025 Home Equity Trends Report.
Disclaimer
These materials discuss general market activity, industry or sector trends, or other broad-based economic, market or political conditions and should not be construed as research or investment advice. Recipients are urged to consult with their financial advisors before buying or selling any securities. The information included herein may not be current and Saluda Grade has no obligation to provide any updates or changes. No representation, warranty or undertaking, express or implied, is given as to the accuracy or completeness of the information or opinions contained herein. Certain information contained in these materials has been obtained from published and non-published sources prepared by third parties, which, in certain cases, have not been updated through the date hereof. While such information is believed to be reliable, Saluda Grade has not independently verified such information, nor does it assume any responsibility for the accuracy or completeness of such information. Except as otherwise indicated herein, the information, opinions and estimates provided in this presentation are based on matters and information as they exist as of the date these materials have been prepared and not as of any future date and will not be updated or otherwise revised to reflect information that is subsequently discovered or available, or for changes in circumstances occurring after the date hereof. Saluda Grade’s opinions and estimates constitute Saluda Grade’s judgment and should be regarded as indicative, preliminary and for illustrative purposes only. Certain information contained in this document constitutes forward-looking statements, and there is no representation or guarantee that they will occur.