
Does Today's Housing Market Resemble 2007?
October 13, 2026
Author: Roger Ashworth, Head of Research and Data
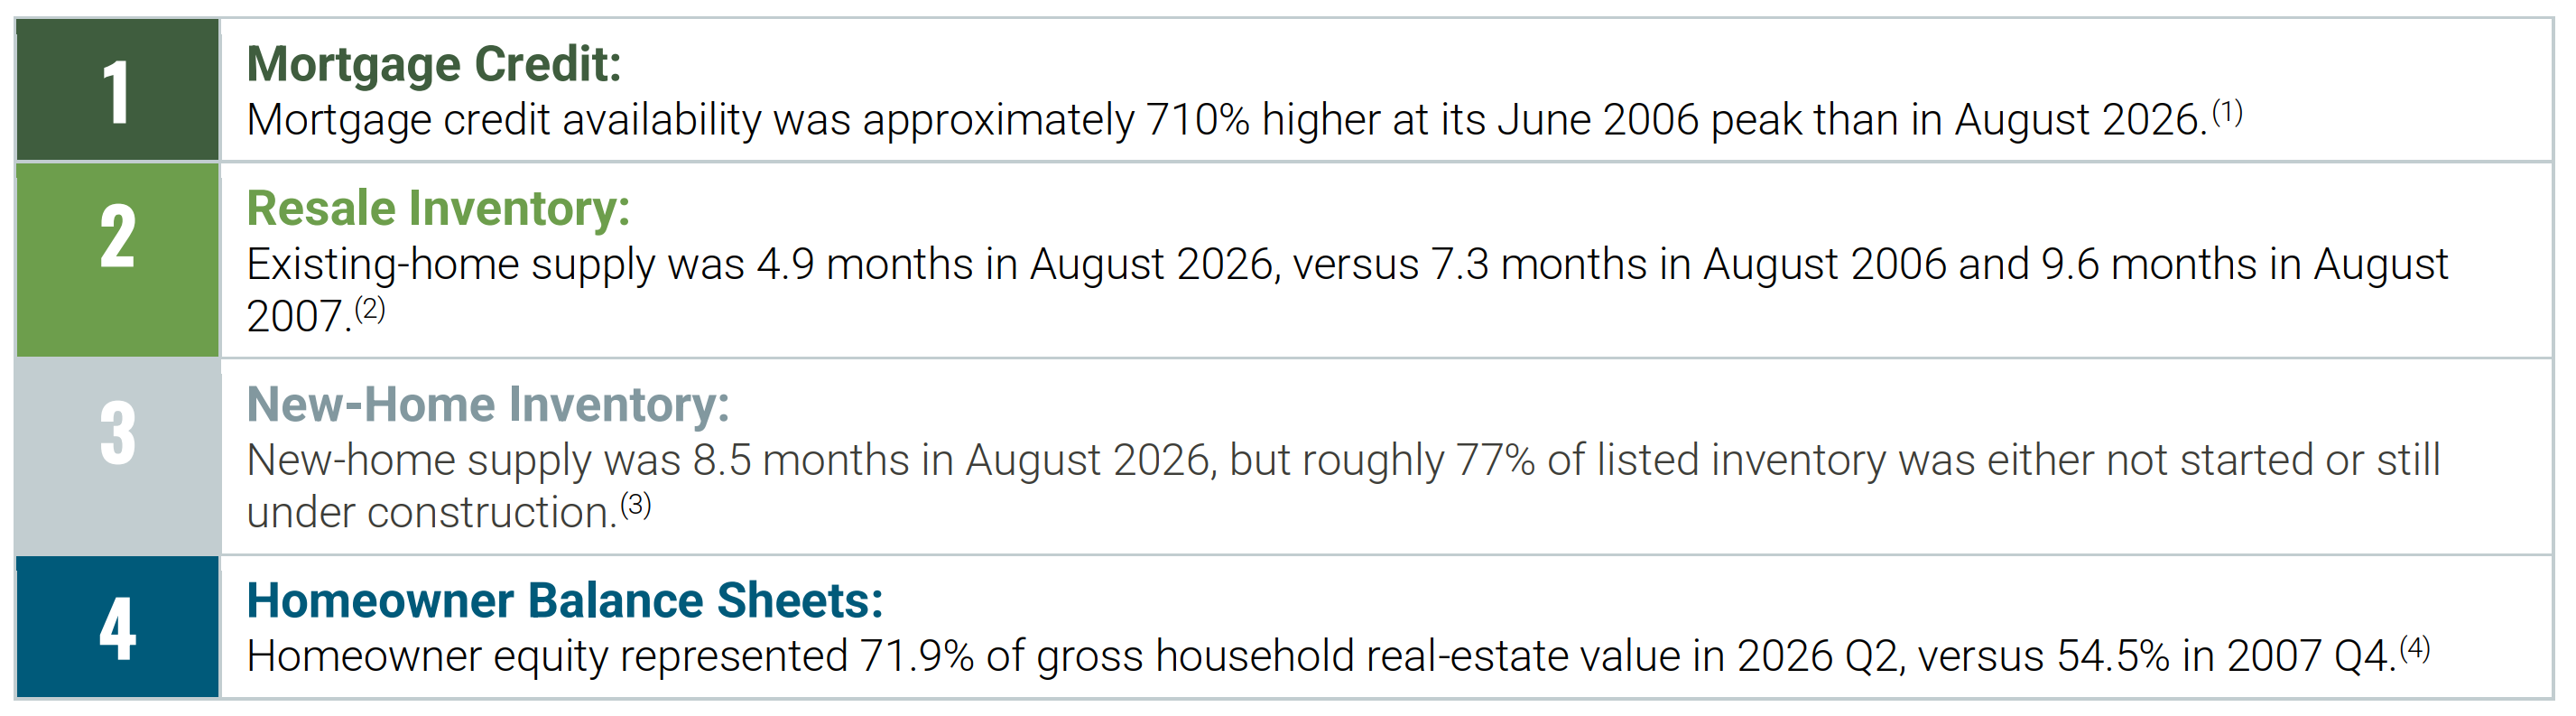
We expect national home prices to continue trending higher, even as builder-heavy or weak-employment markets see declines. The key distinction from 2007 is the transmission mechanism: tighter credit, lower payment-reset exposure, resale inventory near its long-run range, and stronger homeowner equity reduce the risk that localized weakness becomes a nationwide wave of defaults and forced sales. Absent a severe labor-market shock, corrections are more likely to remain regional than to become systemic.
Mortgage Credit Underwriting
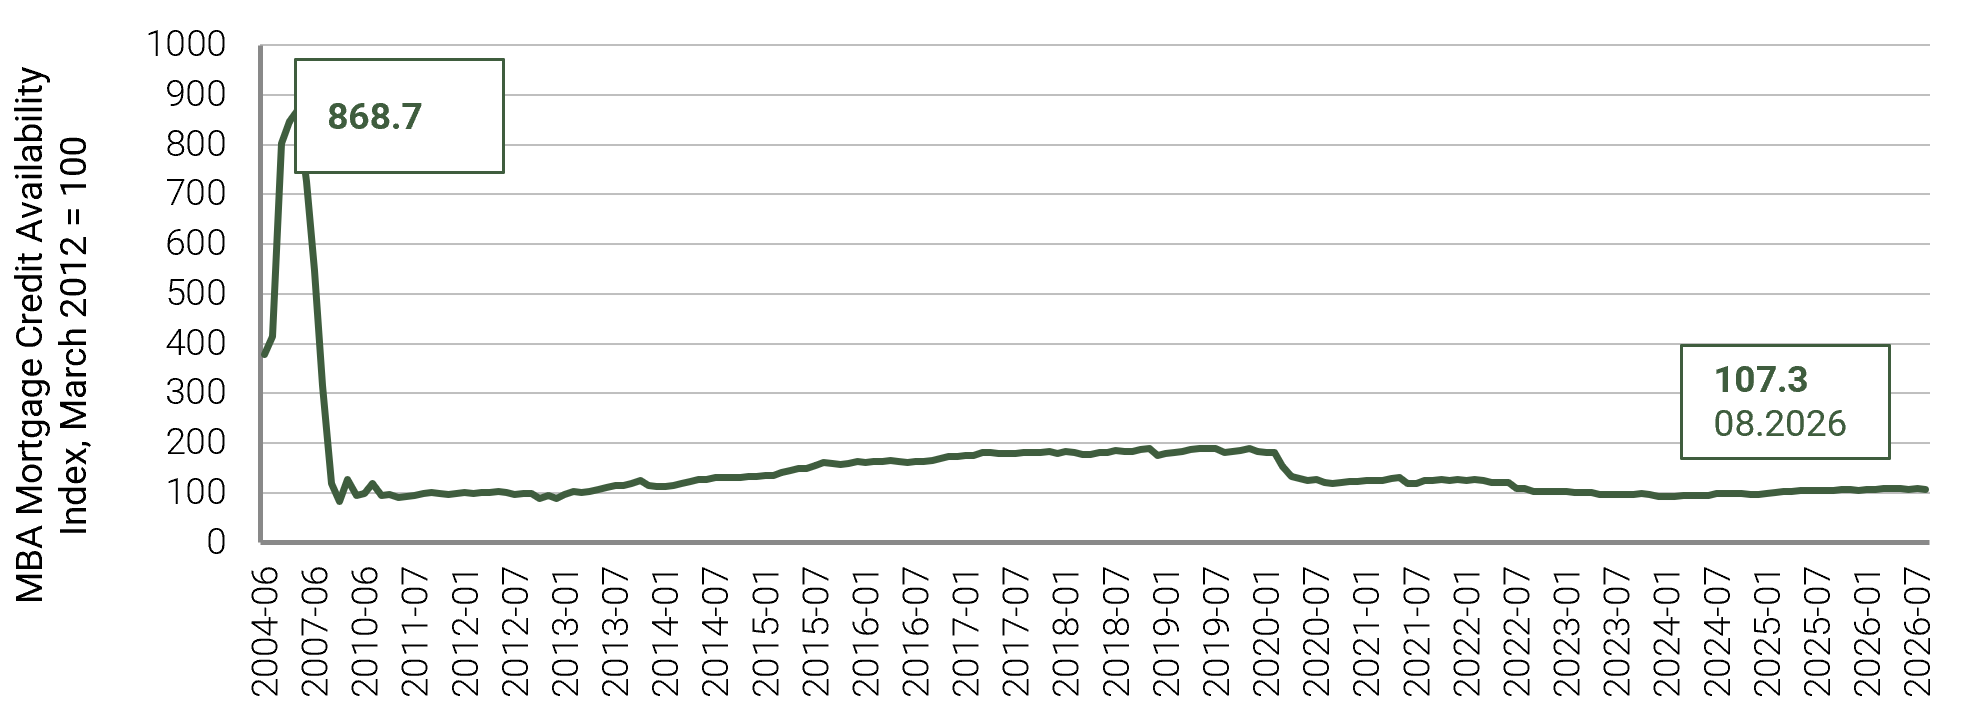
Mortgage credit availability remains materially tighter than in the mid-2000s. The Mortgage Credit Availability Index (MCAI) fell 1.0% to 107.3 in August 2026, though it remained above its December 2023 low of 92.1. At its June 2006 peak, the index was approximately 710% higher than its August 2026 level. The index measures program availability rather than credit quality; MBA said August’s decline reflected reduced offerings of flexible-documentation and cash-out refinance programs, particularly in jumbo lending.(1)
The product mix has also shifted. The average weekly share of adjustable-rate mortgage (ARM) applications was 8.3% of application activity in 2026 through October 2, compared with 31.4% in 2005. ARM applications therefore remain a much smaller share of current mortgage demand than in the prior credit cycle.(5)
Most existing borrowers have limited exposure to higher mortgage rates because nearly all active mortgages are fixed-rate. FHFA estimated that, through 2024 Q2, the average rate on outstanding mortgages was 2.54 percentage points below prevailing market rates.(6) Higher rates often create a strong incentive for borrowers to retain existing loans, reducing refinancing and housing turnover rather than increasing monthly payments.
Post-crisis underwriting requirements further reduce the risk of payment shock. Ability-to-repay rules require lenders to verify repayment capacity and, for ARMs, generally qualify borrowers using the higher fully indexed rate. These rules reduce the scope for loans to be originated on the basis of temporarily low introductory payments. Taken together, the evidence points to a mortgage market in which credit availability has partially recovered from its late-2023 low but remains far below its pre-GFC peak, while rate-reset exposure is limited and repayment capacity is subject to stronger underwriting requirements than before the GFC.
Figure 1: Credit availability remains tight
Source: Mortgage Bankers Association, "Mortgage Credit Availability Index," August 2026 data, released September 10, 2026.
Figure 2: ARM use is far below the mid-2000s
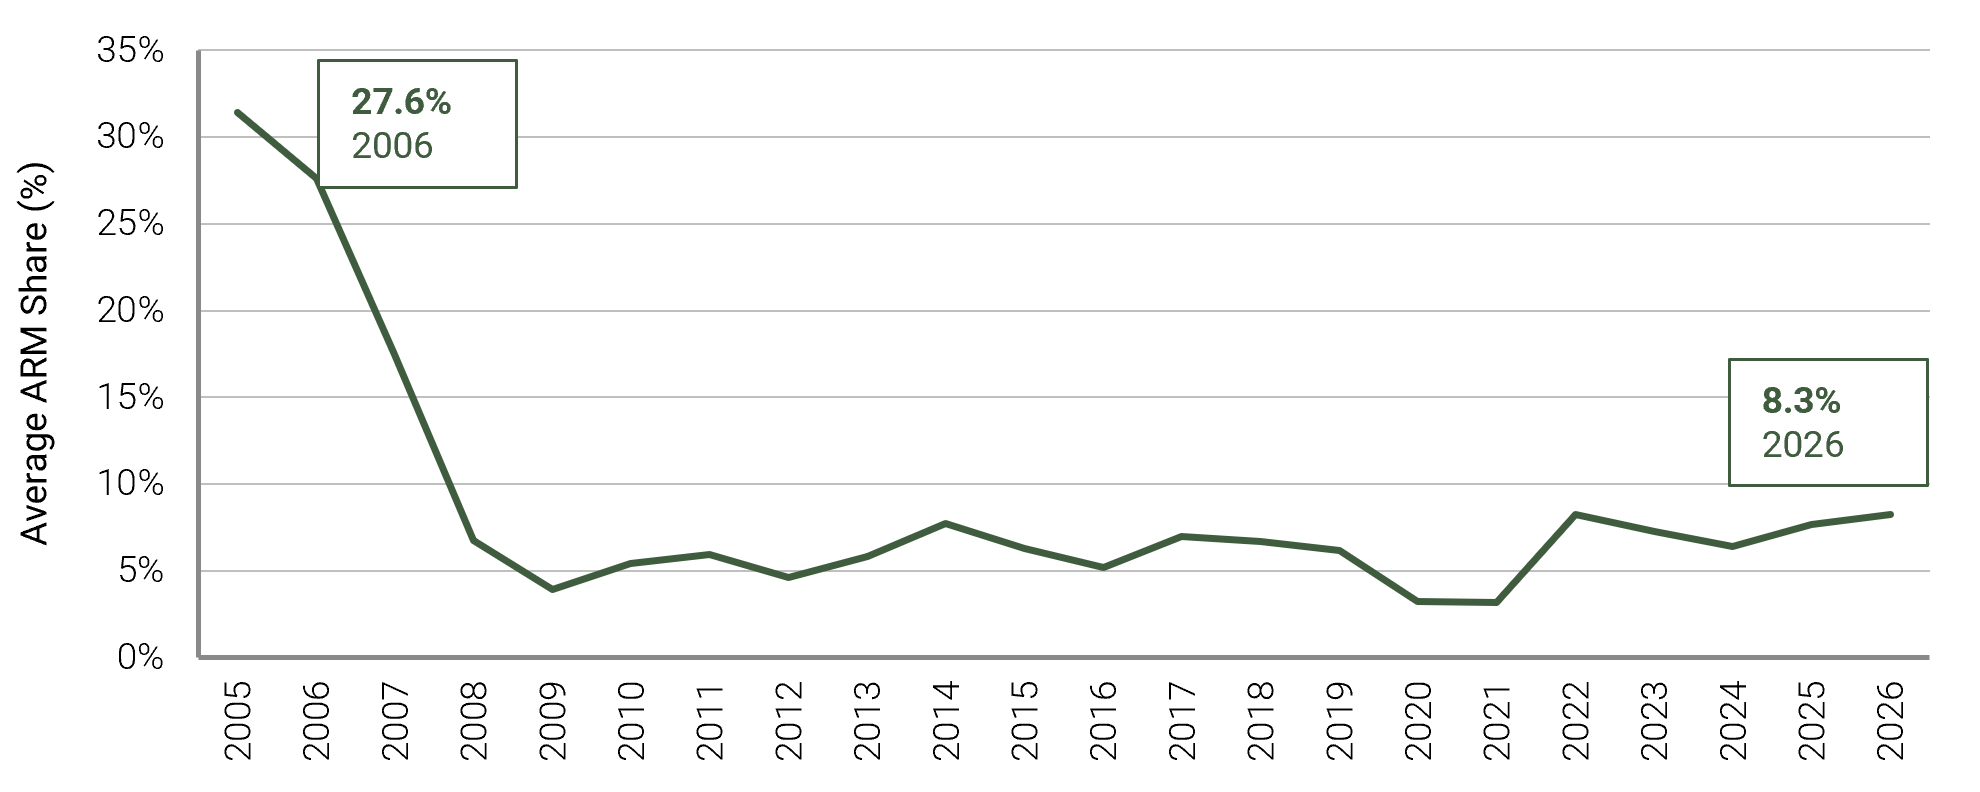
Source: Mortgage Bankers Association, "Weekly Applications Survey," week ended October 2, 2026, released October 7, 2026, and annual history. ARM share is application activity, not funded originations or outstanding loans.
Resale Inventory
Existing-home inventory resumed growing in August. Year-over-year growth peaked near 21% in April 2025, slowed to 1.9% in June 2026, dipped to -0.6% in July, and rebounded to 5.9% in August. Months of supply rose to 4.9 from 4.6 in July. Inventory is building again, but not at the pace seen in early 2025.(2)
Current supply remains below the levels reached during the housing downturn. Existing-home inventory stood at 1.62 million units in August 2026, or 4.9 months of supply, compared with 7.3 months in August 2006 and 9.6 months in August 2007. However, months of supply was 4.7 in August 2005 before rising to 7.3 a year later, showing that a near-normal starting level does not rule out rapid deterioration. Historically, changes in inventory growth have tended to precede changes in home-price growth by roughly a year, although the relationship is descriptive rather than predictive.(2)
Demand has weakened and inventory has risen, but the increase has not produced a 2007-style supply overhang. The average 30-year mortgage rate was 6.67% in August, and existing-home sales fell 2.0% for the month and 1.2% from a year earlier.(2) Pending home sales rose 0.3% for the month but remained 4.7% below a year earlier.(7) Price growth remains subdued: ICE’s repeat-sales index was up 1.5% year over year in July,(8) while the median existing-home price rose 1.6% in August.(2) The adjustment is now visible in both lower transaction activity and greater inventory, although supply remains below downturn levels.
The key downside risk is distressed supply. Voluntary sellers can delay listing, especially when locked into below-market mortgage rates; distressed borrowers cannot. Inventory has moved closer to balanced conditions, but a sustained acceleration driven by forced sales would be a clear sign that current resilience is weakening.
New-home supply presents a different risk: the headline figure is high because much of the pipeline remains under construction, while the median time from completion to sale remains low by historical standards.(3)
Figure 3: Resale supply is near normal; new-home supply is elevated
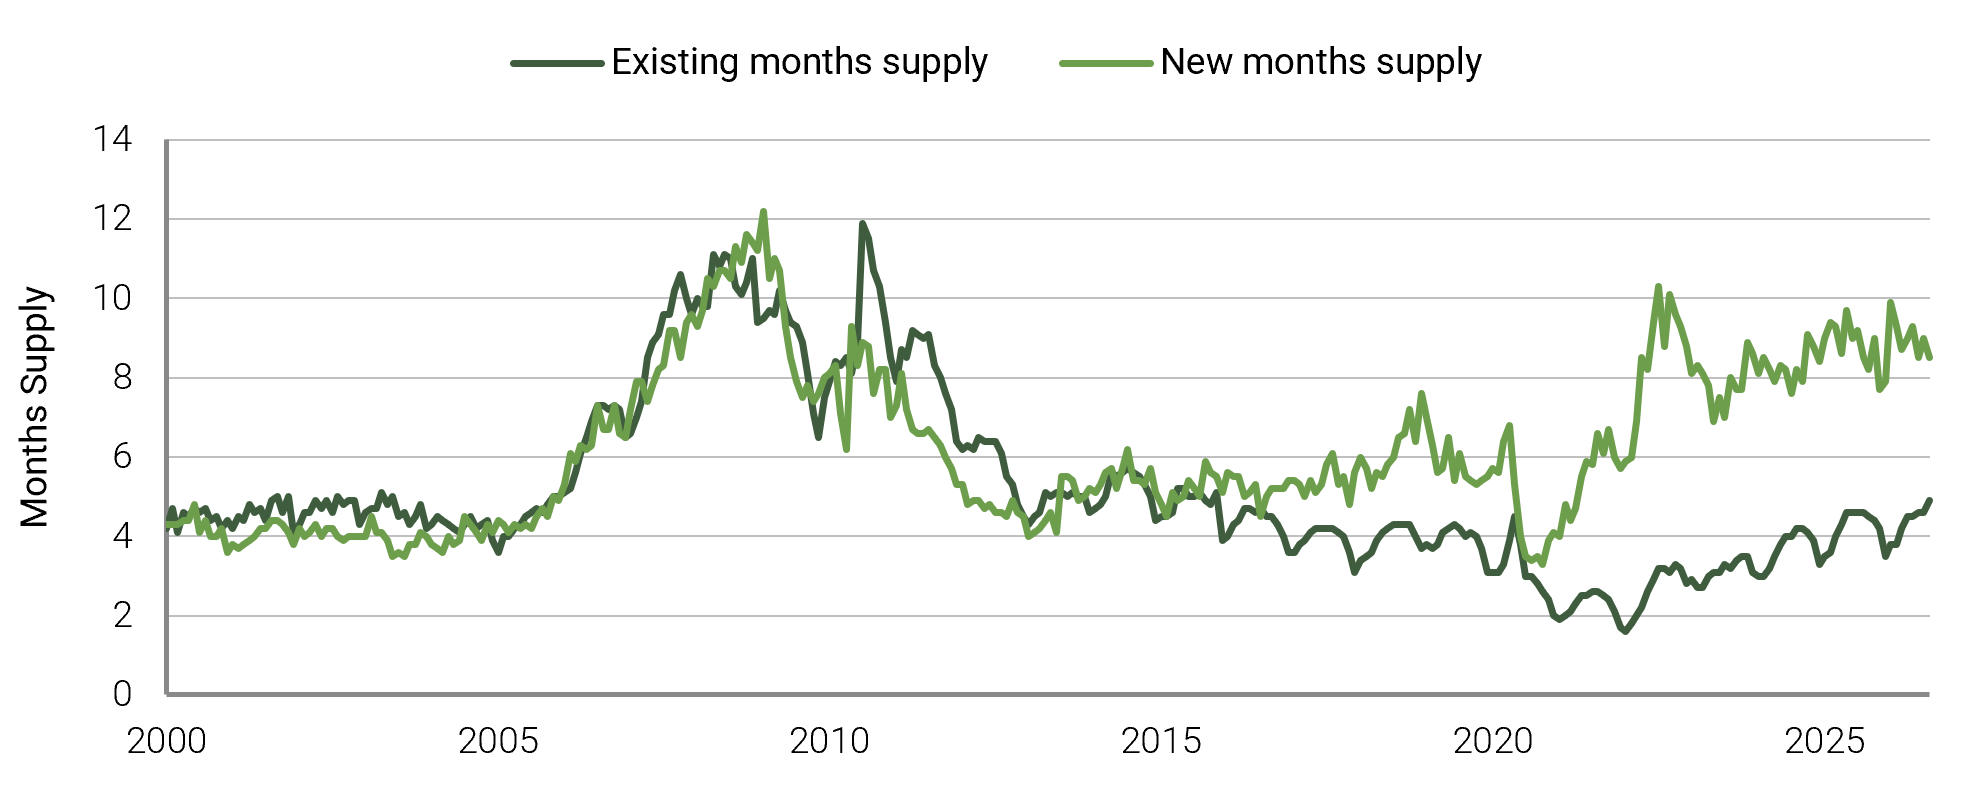
Source: National Association of Realtors, "Existing-Home Sales," August 2026 data, released September 10, 2026, and monthly history. U.S. Census Bureau and HUD, "New Residential Sales," August 2026 data, released September 24, 2026, and monthly history. Preliminary and subject to revision.
New-Home Inventory
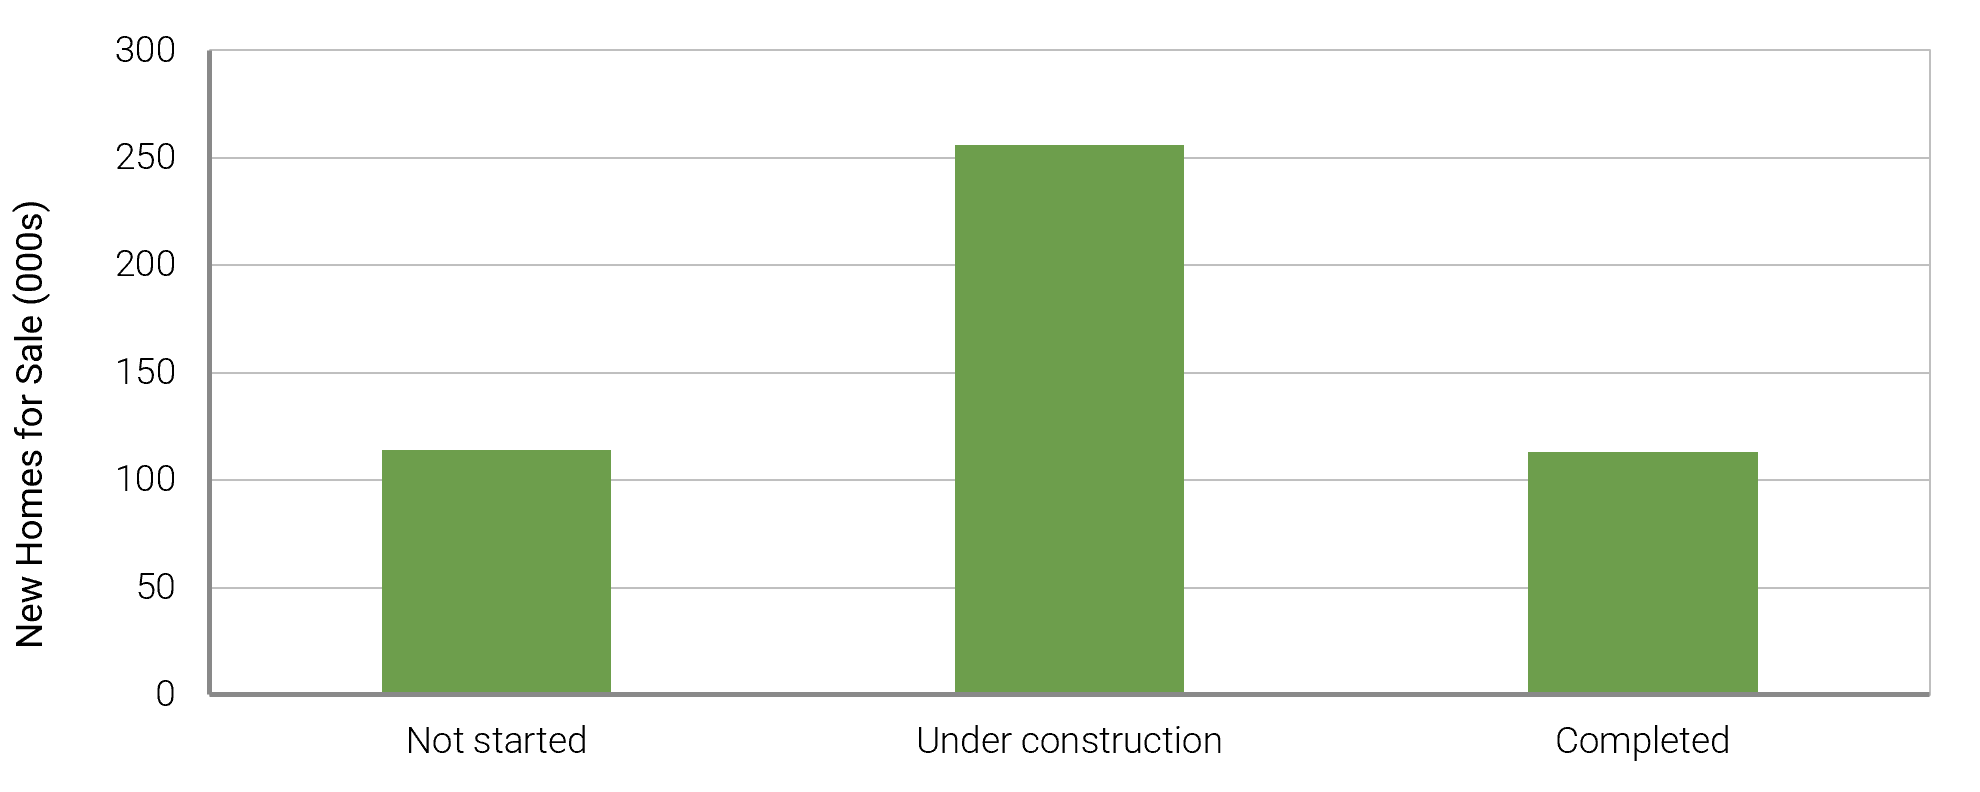
New-home inventory is the primary area where supply exceeds historical norms. Census reported 483,000 new single-family homes for sale in August 2026, equal to 8.5 months of supply. Of that total, 114,000 were not started, 256,000 were under construction, and 113,000 were complete. Roughly 77% of the listed inventory was therefore unfinished, limiting the amount of supply immediately competing for buyers.(3)
The new-home segment also remains a relatively small share of the broader housing market. New homes accounted for about 16% of August single-family sales, based on Census new-home contracts and NAR existing single-family closings.(2)(3) The measures are not perfectly aligned, but they indicate that elevated builder inventory is concentrated in roughly one in six single-family transactions.
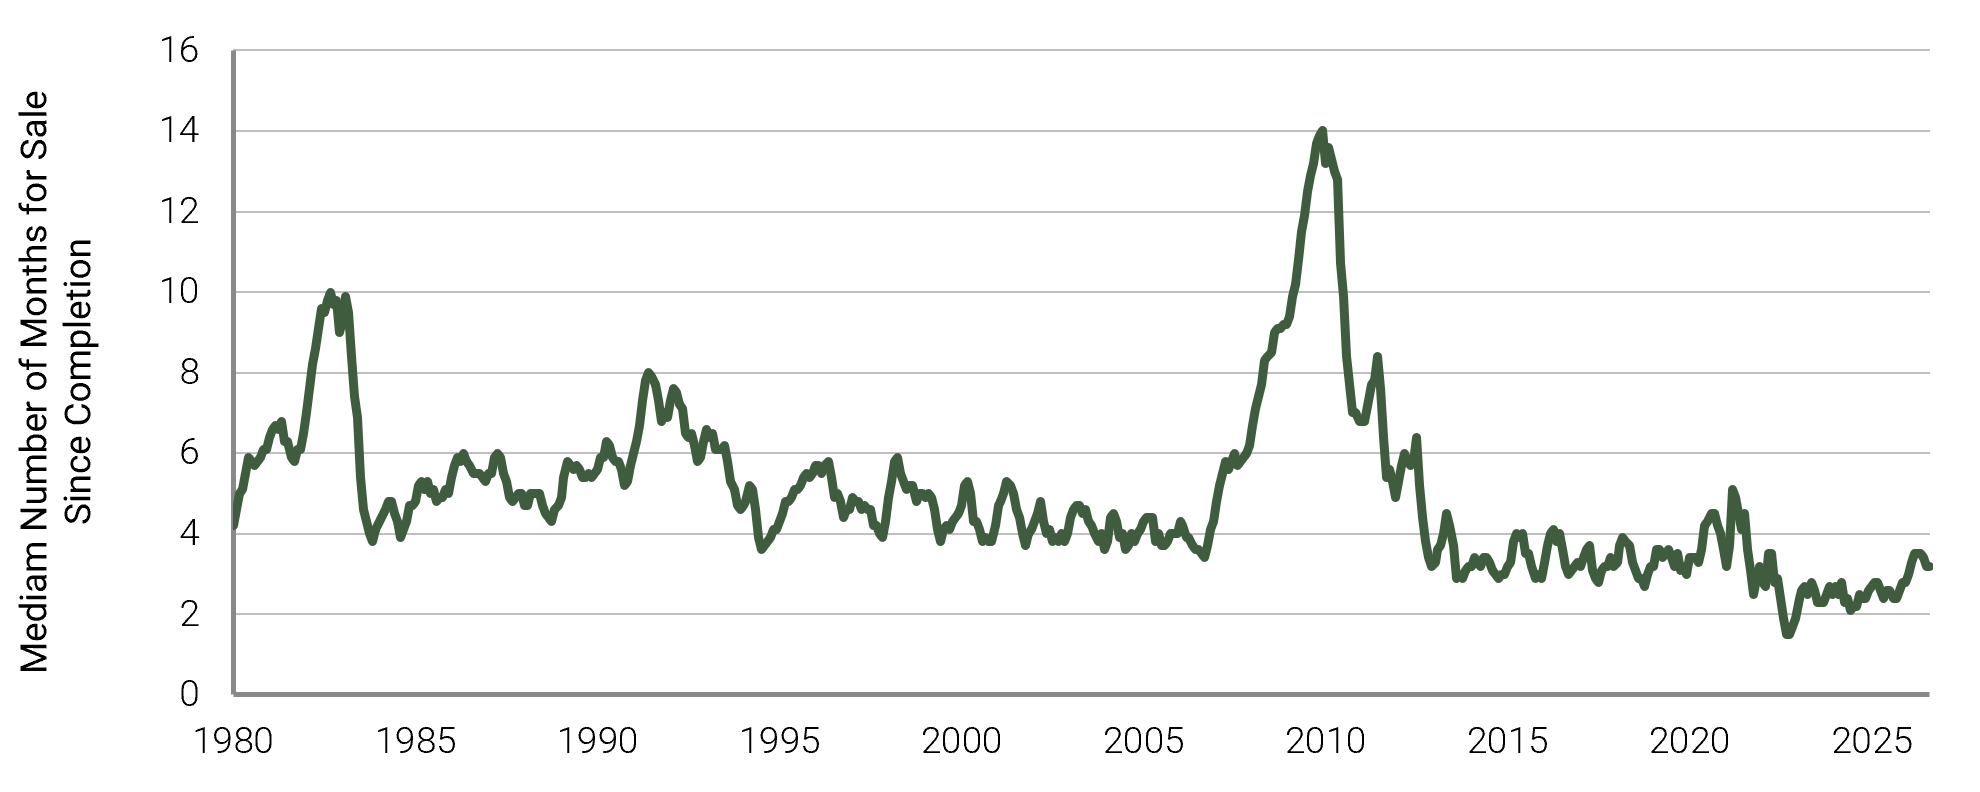
Completed homes do not linger after delivery. Among homes sold after completion, the median time from completion to sale was 3.2 months in August, below the 4.6-month median since 1980. The unfinished pipeline could still pressure builder-heavy markets as units are completed, but it is not equivalent to an immediate overhang of finished homes.(3)
Figure 4: Most new-home inventory is not complete
Source: U.S. Census Bureau and HUD, "New Residential Sales," August 2026 data, released September 24, 2026, and monthly history. Preliminary and subject to revision.
Figure 5: Completed homes continue to sell relatively quickly
Source: U.S. Census Bureau and HUD, "New Residential Sales," August 2026 data, released September 24, 2026, and monthly history. Preliminary and subject to revision.
Homeowner Balance Sheets
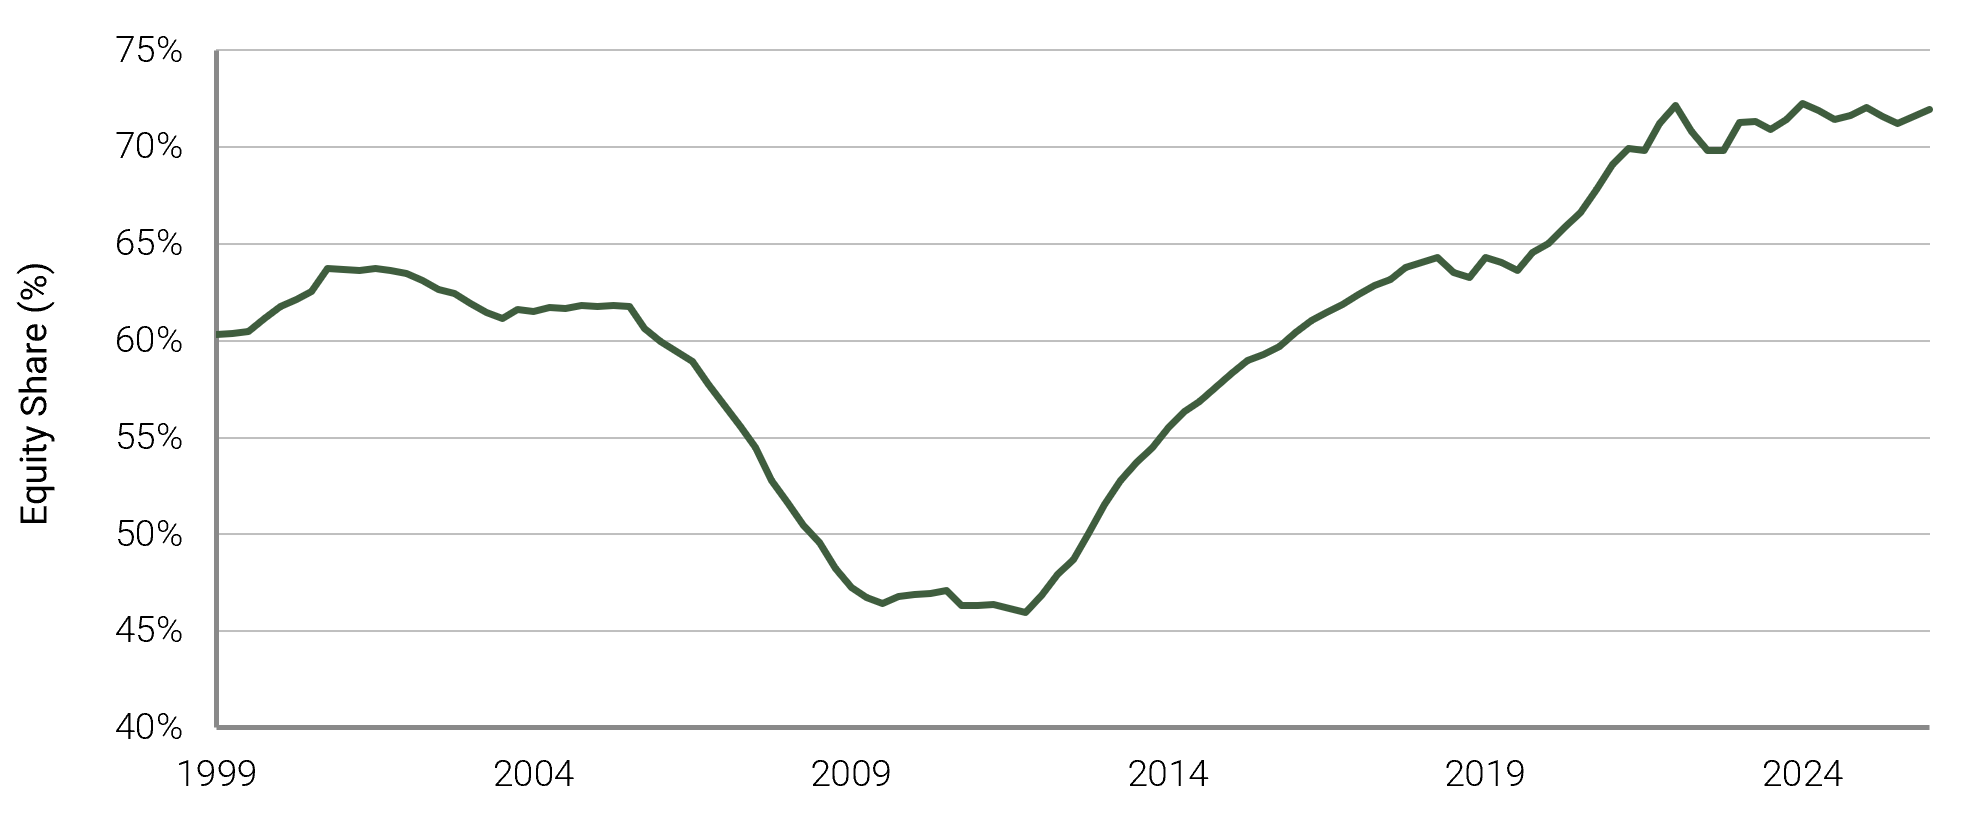
Homeowners hold substantially more equity than before the GFC. Federal Reserve data show $35.8 trillion in homeowner real-estate equity in 2026 Q2, equal to 71.9% of gross household real-estate value, compared with 54.5% in 2007 Q4. Higher equity does not prevent home prices from falling, but it reduces the risk that price declines leave borrowers with little or no equity and increases their capacity to absorb a sale without realizing a mortgage shortfall.(4)
The cushion is broader than the aggregate ratio alone suggests. Census estimates that 39.4% of owner-occupied homes were owned free and clear.(9) Among actively mortgaged properties, FHFA’s National Mortgage Database reported a count-weighted average first-lien mark-to-market LTV of 45.1% in Q2 2026.(10) The latter excludes HELOCs and other subordinate debt, so it should not be mechanically converted into a total-equity percentage.
Figure 6: Homeowner equity is near a multidecade high
Source: Federal Reserve, "Financial Accounts of the United States," household balance-sheet Table B.101, 2026 Q2, released September 11, 2026.
Mortgage Performance And Household Debt Service
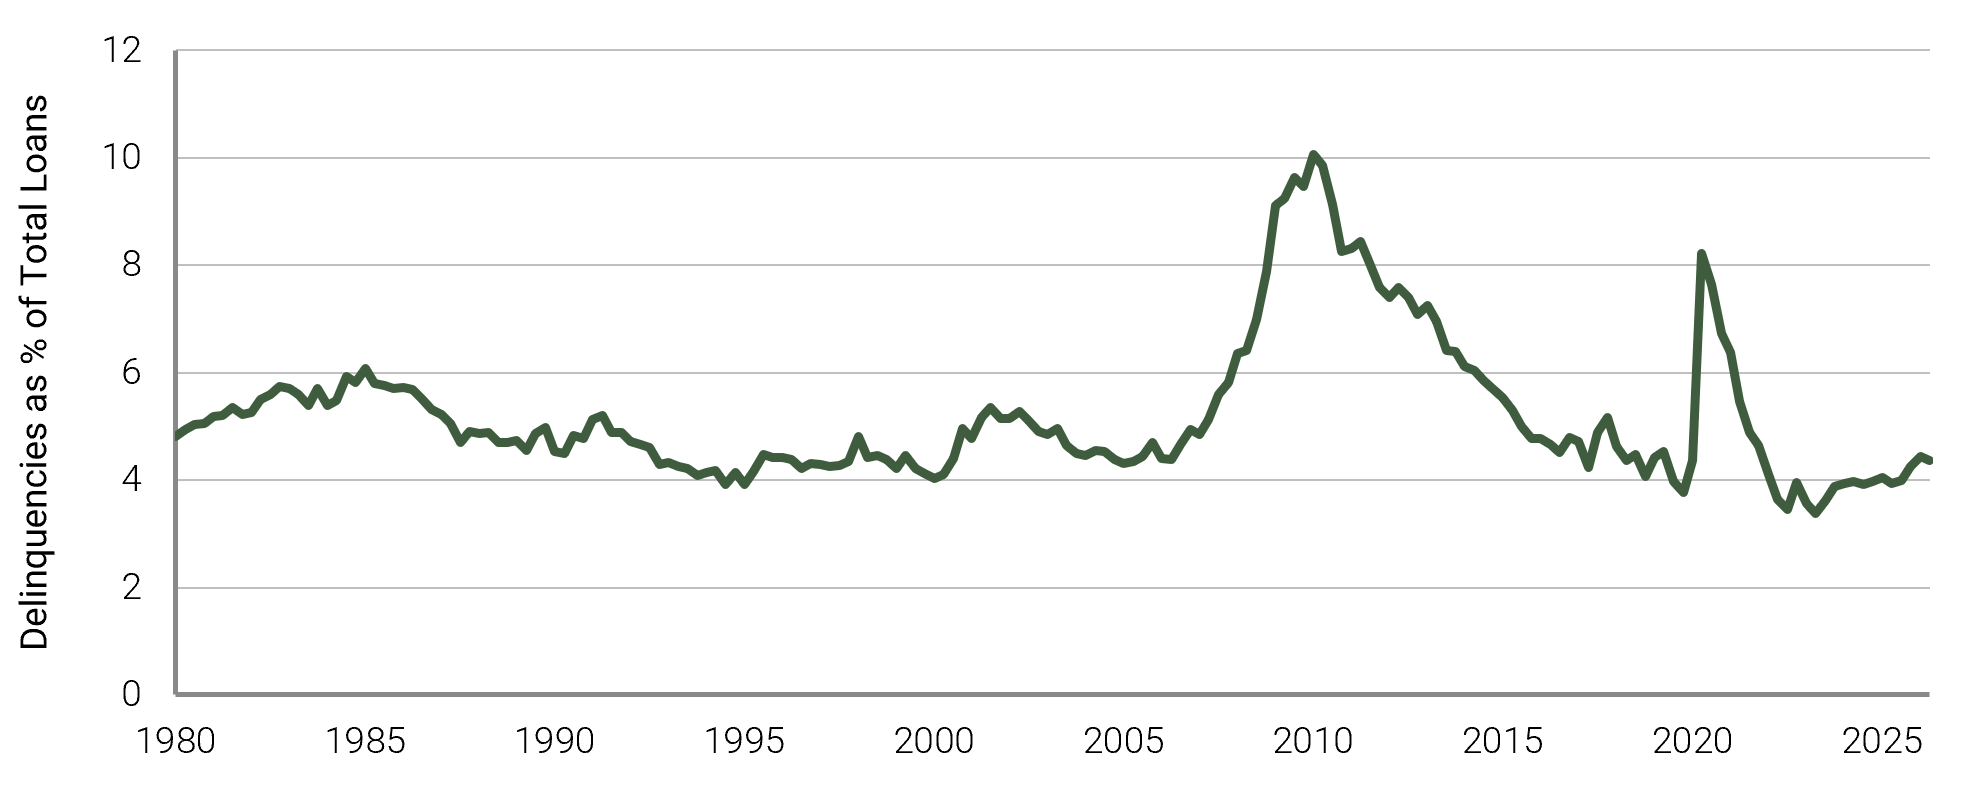
Mortgage performance has softened slightly, but national data do not yet signal broad-based homeowner distress. The MBA’s seasonally adjusted delinquency rate for one-to-four-unit residential mortgages was 4.37% in the second quarter of 2026, down 7 basis points from the first quarter and up 44 basis points from a year earlier. The rate remains below its 5.20% average since 1980, below the 5.82% rate in 2007 Q4, and less than half the 10.06% peak reached in 2010 Q1. Serious delinquency and weaker FHA performance still warrant monitoring.(12)
Figure 7: Mortgage delinquencies remain low by historical standards
Source: Mortgage Bankers Association, "National Delinquency Survey," 2026 Q2, released August 13, 2026. Delinquency rate covers one-to-four-unit residential loans at least one payment past due and excludes loans in foreclosure.
Aggregate household debt service has also remained contained despite higher market rates. Under the Federal Reserve’s current methodology, required debt payments equaled 11.11% of disposable personal income in 2026 Q2, essentially unchanged from 11.10% in 2023 Q4, below 11.73% in 2019 Q4, and well below 15.85% in 2007 Q4. The mortgage component was 5.83%, compared with 8.95% in 2007 Q4, while the consumer component was 5.28%, compared with 6.89%.(11)
The fixed-rate mortgage stock is an important stabilizer. Higher mortgage rates have reduced affordability for new buyers, but they have not repriced most outstanding mortgage payments. Recent borrowers and users of revolving or variable-rate credit face greater pressure, and aggregate measures can mask household-level stress. Even so, the national data remain much stronger than they were entering the GFC and do not indicate a broad mortgage-stress cycle.
Figure 8: Household debt-service burdens remain below 2007
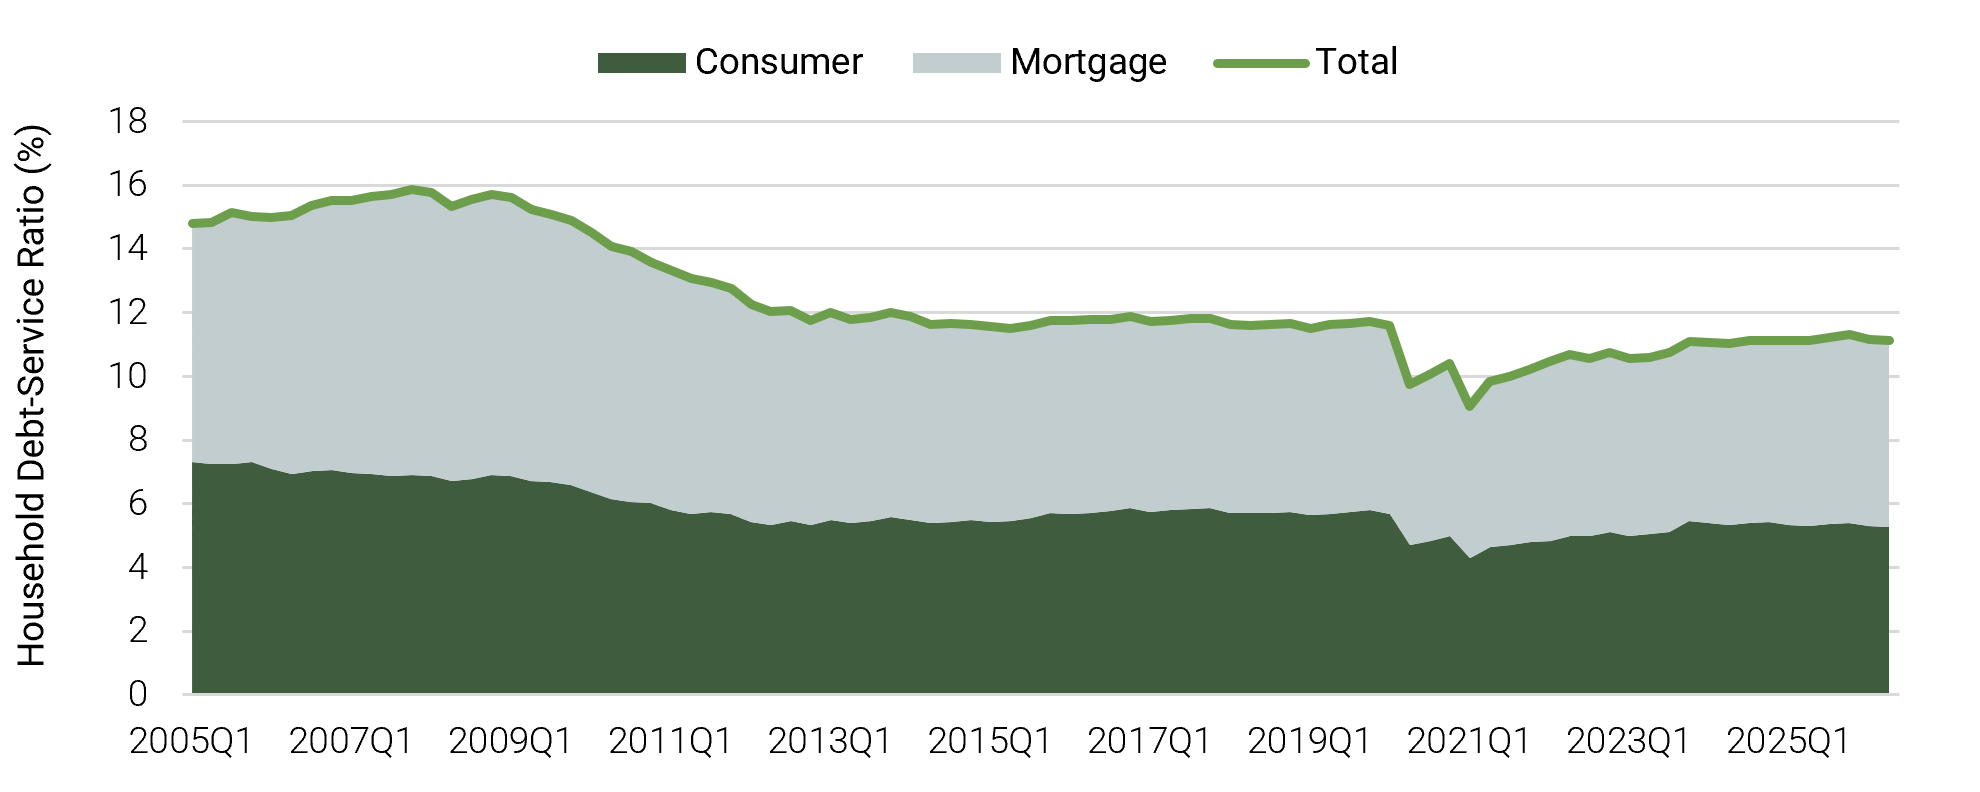
Source: Federal Reserve, "Household Debt Service Ratios," current methodology, total, mortgage, and consumer components, 2026 Q2, released September 22, 2026.
What Would Change The Outlook
Five developments could weaken the thesis. First, a broad labor-market shock would be the most direct challenge: fixed-rate mortgages protect borrowers from payment resets, but not from lost income, and a sustained rise in unemployment could convert affordability pressure into delinquency and forced selling.
Second, a broader spread of negative equity and delinquency beyond recent FHA and VA cohorts would increase the risk that borrower-level stress feeds into the resale supply. Existing-home inventory has resumed growing; a sustained acceleration driven by distressed listings would be a clear sign that current resilience is weakening.
Third, builder-heavy markets could reprice sharply, an outcome that would likely first appear through broader incentives, price cuts, and weaker regional pricing.
Fourth, the unfinished new-home pipeline could reach completion faster than demand can absorb it, converting a backlog that is currently insulated from the market into competing supply.
Fifth, further loosening in reduced-documentation and non-QM lending would weaken the credit-quality distinction that separates the current cycle from the pre-GFC period.
Conclusion
Today’s environment is clearly different from the housing market in 2007. Affordability remains strained, and while we don’t expect a material correction in home prices, they can still decline. Today’s transmission mechanism is materially different from 2007. Tighter credit, lower payment-reset risk, and stronger homeowner balance sheets reduce the likelihood that any weakness becomes a nationwide cycle of defaults and forced sales. Absent a severe labor-market shock, adjustment is more likely to occur through low turnover, builder incentives, and uneven regional price declines than through a broad mortgage-led liquidation cycle.
Sources:
(1) Mortgage Bankers Association, "Mortgage Credit Availability Index," August 2026 data, released September 10, 2026.
(2) National Association of Realtors, "Existing-Home Sales," August 2026 data, released September 10, 2026, and monthly history.
(3) U.S. Census Bureau and HUD, "New Residential Sales," August 2026 data, released September 24, 2026, and monthly history. Preliminary and subject to revision.
(4) Federal Reserve, "Financial Accounts of the United States," household balance-sheet Table B.101, 2026 Q2, released September 11, 2026.
(5) Mortgage Bankers Association, "Weekly Applications Survey," week ended October 2, 2026, released October 7, 2026, and annual history. ARM share is application activity, not funded originations or outstanding loans.
(6) Federal Housing Finance Agency, "The Geography of the Lock-In Effect," and FHFA Working Paper 24-03. Fixed-rate share of active mortgages and lock-in rate differential through 2024 Q2.
(7) National Association of Realtors, "Pending Home Sales," August 2026 data, released September 17, 2026.
(8) ICE Mortgage Monitor, August 2026. July 2026 ICE Home Price Index annual growth.
(9) U.S. Census Bureau, mortgage-free owner-occupied homes, 2020–24 American Community Survey five-year estimates.
(10) Federal Housing Finance Agency, National Mortgage Database, active closed-end first liens, 2026 Q2, released September 30, 2026.
(11) Federal Reserve, "Household Debt Service Ratios," current methodology, total, mortgage, and consumer components, 2026 Q2, released September 22, 2026.
(12) Mortgage Bankers Association, "National Delinquency Survey," 2026 Q2, released August 13, 2026. Delinquency rate covers one-to-four-unit residential loans at least one payment past due and excludes loans in foreclosure.
Disclaimer
These materials are general information only, not investment advice or a recommendation to buy or sell any security. The information included herein may not be current and Saluda Grade has no obligation to provide any updates or changes. No representation, warranty, or undertaking, express or implied, is given as to the accuracy or completeness of the information or opinions contained herein. Certain information contained in these materials has been obtained from published and non-published sources prepared by third parties, which, in certain cases, have not been updated through the date hereof. While such information is believed to be reliable, Saluda Grade has not independently verified such information, nor does it assume any responsibility for the accuracy or completeness of such information. Except as otherwise indicated herein, the information, opinions and estimates provided in this presentation are based on matters and information as they exist as of the date these materials have been prepared and not as of any future date and will not be updated or otherwise revised to reflect information that is subsequently discovered or available, or for changes in circumstances occurring after the date hereof. Saluda Grade’s opinions and estimates constitute Saluda Grade’s judgment and should be regarded as indicative, preliminary and for illustrative purposes only. Certain information contained in this document constitutes forward-looking statements, and there is no representation or guarantee that they will occur.