
U.S. Rental Markets: Is Supply the Real Story Behind 2026's Hottest and Coldest Markets?
August 12, 2026
Author: Roger Ashworth, Head of Research
Special Thanks: James Morello, Summer Intern
Note: Market projections are provided for informational purposes only and are not guarantees of future results. There is no assurance that any projections will be achieved.
The Geographic Divide
The U.S. multifamily rental market is splitting along sharp geographic lines. Supply-constrained metros, primarily in the Gateway, Midwest, and Northeast corridors, are posting positive rent growth where new construction has lagged demand. By contrast, many Sun Belt and Mountain West markets that overbuilt through 2022–23 are experiencing steep declines as record deliveries outpace absorption. The result is widening dispersion in rent growth, vacancy, and forward collateral risk.
The Hottest Markets
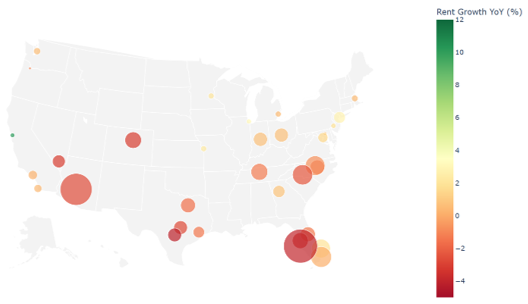
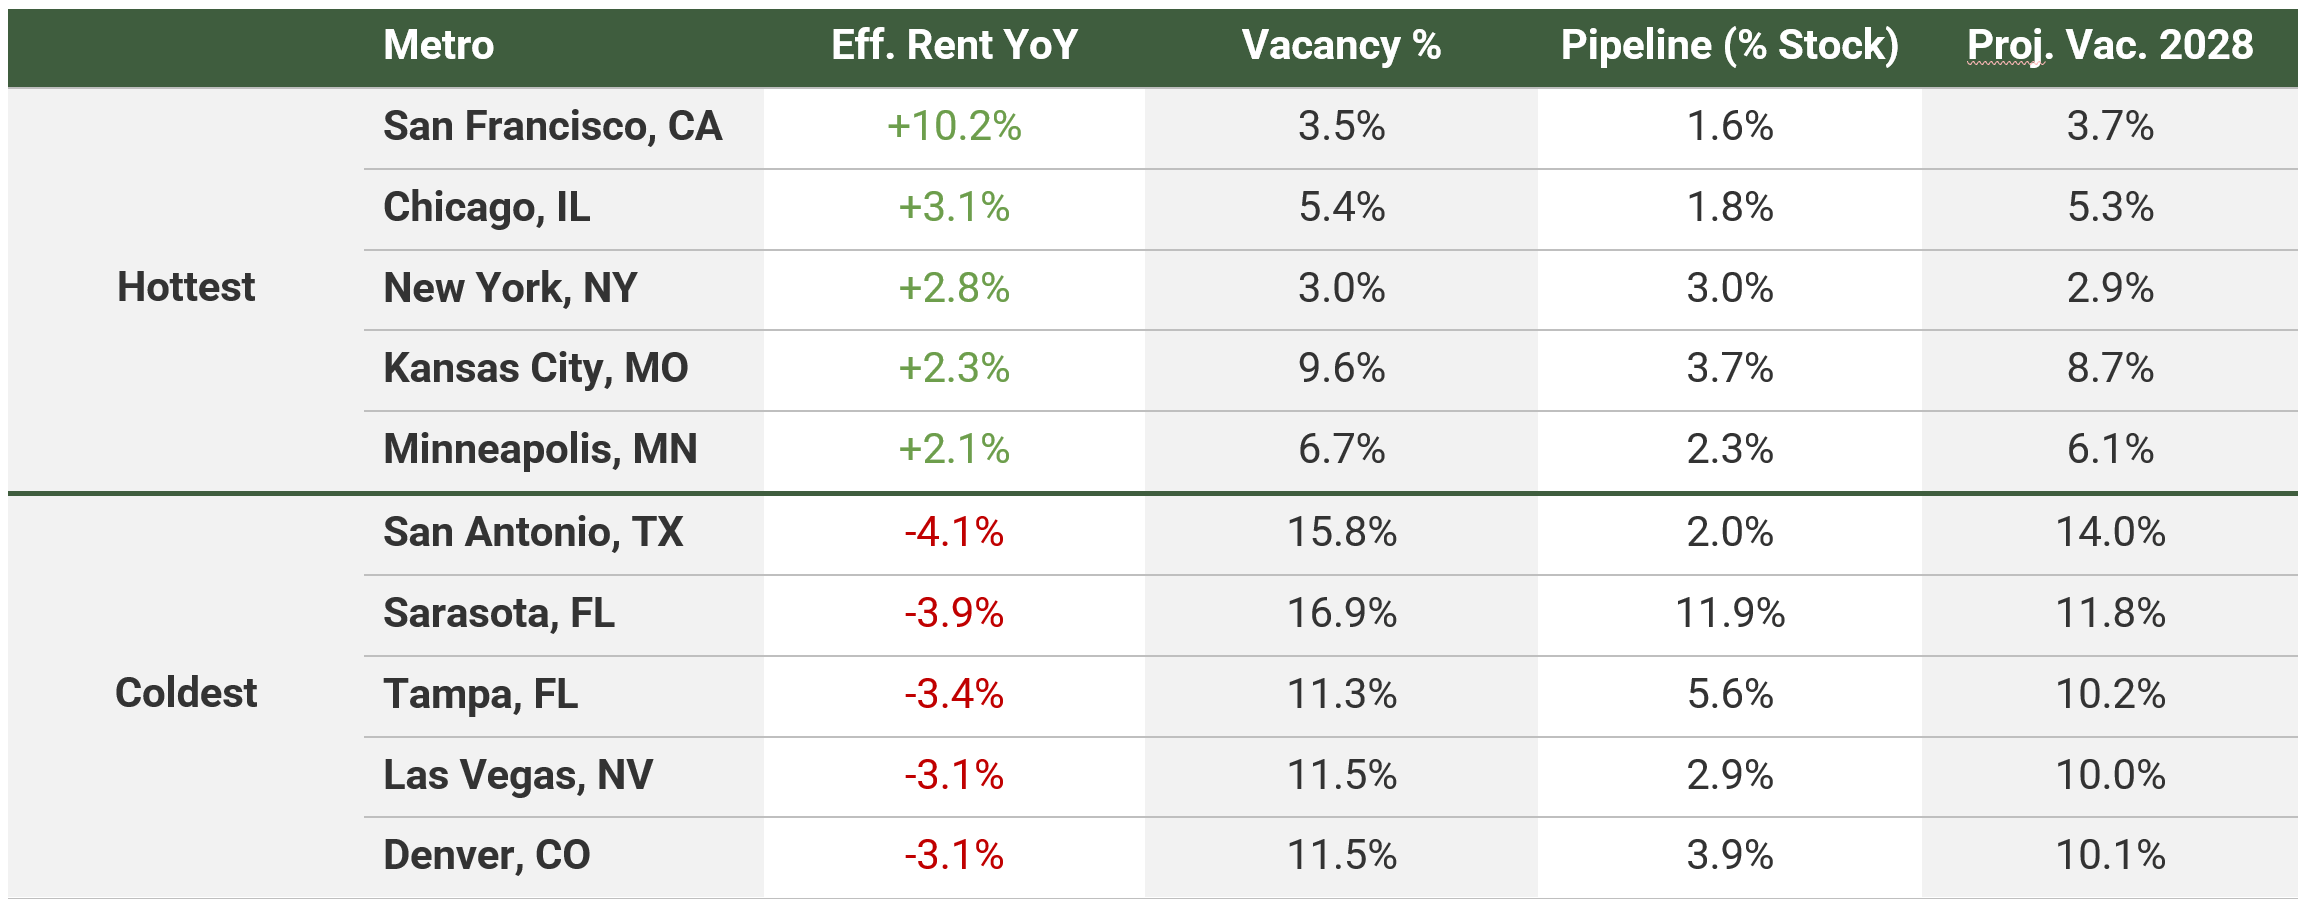
The metros leading in year-over-year (YoY) rent growth share a common trait: thin construction pipelines. San Francisco tops the list at +10.2%, driven by a 3.5% vacancy rate – one of the tightest in our 33-metro sample, with only New York lower at 3.0%. Years of construction underinvestment and housing shortages, combined with a return-to-office push and AI-driven hiring, have left the Bay Area acutely undersupplied.
Chicago (+3.1%), New York (+2.8%), Kansas City (+2.3%), and Minneapolis (+2.1%) round out the top five in rent growth. Each of the five has a pipeline below the 3.9% sample average. Chicago and New York each have pipelines of 3.0% of stock or less. Kansas City is the outlier: its 9.6% vacancy rate sits 1.6pp above its 2015–19 average, and its 3.7% pipeline is the largest of the five, making its rent growth the least supply-supported of the group. The common thread is not booming demand. Chicago’s population, for example, contracted 0.2% year over year. Rather, pricing power is supported by the absence of a significant supply overhang.
Figure 1: Rent Growth vs. Construction Pipeline by Metro
Bubble size = Under Construction % of Stock
Source: CoStar multifamily panel with Q2 2026 base case and forecasts through Q4 2028; Saluda Grade internal “MF Metro Collateral Scorecard” based on 2015–19 average vacancies.
The Coldest Markets
At the opposite extreme, multiple Sun Belt and Mountain West metros posted rent declines exceeding 3%: San Antonio (-4.1%, 15.8% vacancy), Sarasota (-3.9%, 16.9% vacancy), Tampa (-3.4%), Las Vegas (-3.1%), and Denver (-3.1%). Unlike the 2008 and 2009 downturns, when rental-market weakness was primarily driven by a contraction in demand, today’s weakness is largely a supply story. Developers chased population-growth headlines into 2022–23 and delivered record unit volumes into markets where absorption could not keep pace.
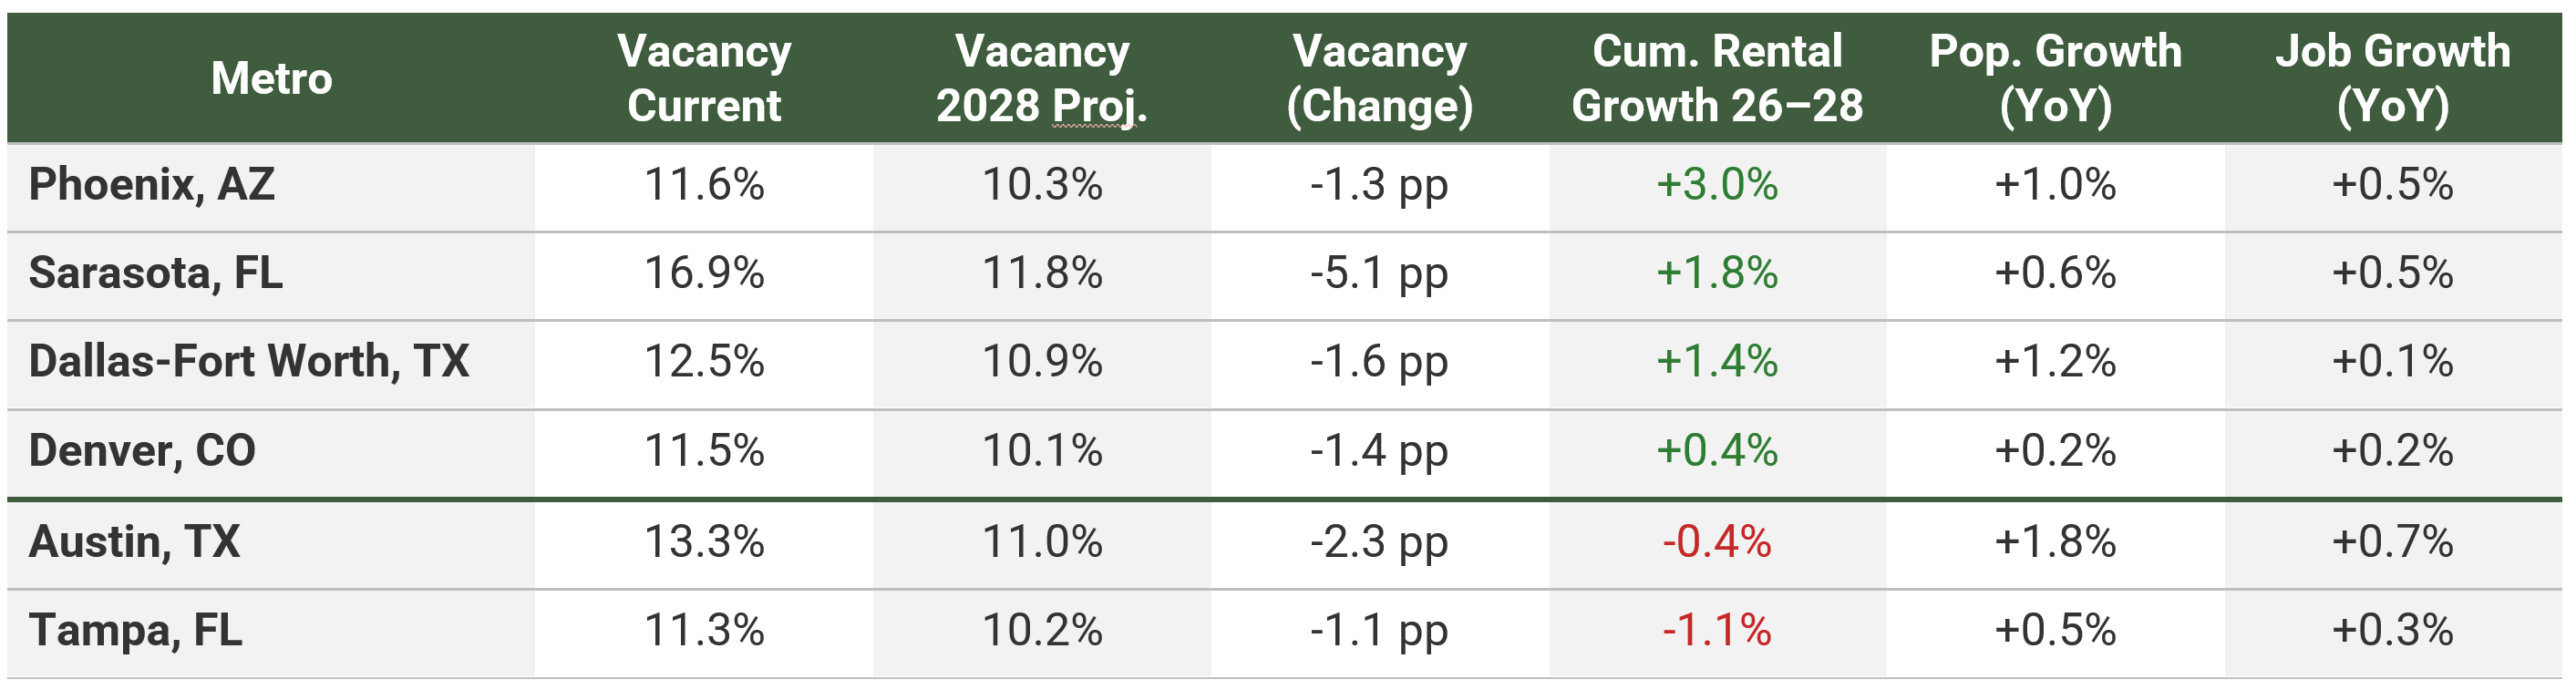
Austin, often cited for its recent overbuilding of rental properties, has a 13.3% vacancy rate and is seeing rents down 2.7% YoY. At the same time, its population increased by 1.8%, and employment grew by 0.7%. These figures do not indicate a broad demand contraction. The problem is that strong demand met even stronger supply, flooding the market with units faster than new households could absorb them.
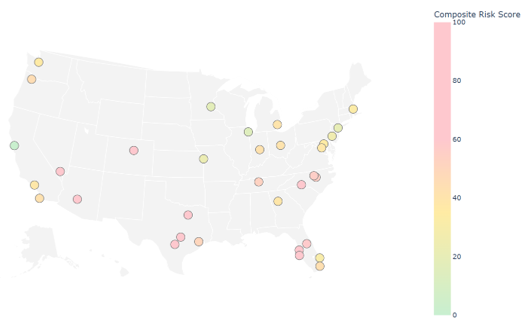
Figure 2: Multifamily Collateral Risk by Metro (Current Composite Score)
Source: CoStar multifamily panel with Q2 2026 base case and forecasts through Q4 2028; Saluda Grade internal “MF Metro Collateral Scorecard” based on 2015–19 average vacancies.
Supply Pipeline: The Rent-Growth Challenger
The construction pipeline offers a clearer explanation of near-term rent performance than any demand metric alone. The ten metros with the highest under-construction percentages, averaging 6.6% of stock, recorded average rent declines of 1.3% YoY. By comparison, the ten metros with the lowest pipelines, averaging 1.7%, posted average growth of +1.0%. Across our 33-metro sample, high-pipeline markets consistently posted weaker rent performance than low-pipeline markets.
A comparison of the extremes, Sarasota and San Francisco, illustrates the relationship. Sarasota, our sample’s second-coldest market at -3.9% rent growth, has 11.9% of its existing stock under construction. San Francisco, the hottest at +10.2%, has only 1.6% of inventory under construction.
Portland is a notable exception. Despite the sample’s smallest pipeline at 0.9%, rents declined by 1.0%, while job growth was -0.9%, pointing to demand weakness rather than oversupply. For most metros, however, the message holds. Strong demographic growth does not necessarily translate into near-term rent growth when deliveries have materially outpaced the market’s absorption capacity.
Figure 3: Hottest and Coldest Metros
Source: CoStar multifamily panel with Q2 2026 base case and forecasts through Q4 2028; Saluda Grade internal “MF Metro Collateral Scorecard” based on 2015–19 average vacancies.
The Recovery Story
Current weakness does not necessarily imply permanent impairment. Nine of the coldest markets, including all five with rent declines exceeding 3%, show improving forward trajectories in our collateral scorecard. Projected vacancy in these metros declines by an average of 1.9 percentage points by 2028 as construction pipelines clear and structural demand, including population and employment growth, continues.
Dallas, Denver, and Phoenix are all reporting negative rent growth today, but vacancy is projected to decline from 11.5%–12.5% to roughly 10%–11% by 2028. Sarasota is the extreme case, falling from 16.9% to 11.8%. As deliveries slow and lease-up progresses, vacancy tightens, but it does not return to normal in the near term. These metros are still projected to remain above their 2015–19 average vacancy at the end of 2028. The recovery is partial and slow, which is exactly why it reads as a timing problem rather than an impairment.
Figure 4: Some Cold Metros are Showing Improving Fundamentals
Source: CoStar multifamily panel with Q2 2026 base case and forecasts through Q4 2028; Saluda Grade internal “MF Metro Collateral Scorecard” based on 2015–19 average vacancies.
Compare these to metros like Baltimore or Detroit, where low current vacancy rates (7.7% and 8.0%, respectively) mask stagnant or declining population and job growth. Baltimore’s job base contracted 0.7% year over year, and Detroit’s population declined 0.1%. The distinction matters because it appears that the supply-shocked Sun Belt group has a timing problem, whereas demand-constrained metros have a potential collateral-quality problem.
Implications for Capital Allocation
For lenders and allocators, the practical implication is that the construction pipeline should carry at least as much weight as historical rent trends in any collateral screen. Markets with low pipelines and tight vacancy rates, such as San Francisco, New York, and Chicago, support continued rent growth and pose lower collateral risk. Markets with elevated pipelines but strong demographic tailwinds, such as Austin, Dallas, and Phoenix, require a view on timing and the pace of absorption rather than a blanket risk-off posture.
The risk is misclassification: mistaking temporary supply pressure for permanent impairment or mistaking structural demand weakness for a routine lease-up cycle. The hottest and coldest rental markets of 2026 are opposite ends of the same supply-demand cycle. The question for allocators is not which side to take; it is whether they can distinguish between the two before the market reprices the difference.
Methodology
Screens 33 major U.S. multifamily metros on collateral quality for asset-backed / CRE credit, then layers in forward trajectory and structural demand. Integrates four questions: where collateral risk sits today (Composite Risk), where it is heading (Forward Trajectory to 2028), why it moves (empirical driver panels, n=5,760), and how the rent stack differs by unit type (Bedroom Analysis — the workforce vs. larger-unit proxy). Four components, each normalized from 0 (low risk) to 100 (high risk) between editable anchors, then weighted: Rent momentum 35%, Vacancy level 20%, Supply shock (vacancy deviation vs 2015–19 avg) 25%, and Pipeline (under-construction % of stock) 20%. Tier 1 <35, Tier 2 35–60, and Tier 3 >60.
Disclaimer
These materials discuss general market activity, industry or sector trends, or other broad-based economic, market or political conditions and should not be construed as research or investment advice. Recipients are urged to consult with their financial advisors before buying or selling any securities. The information included herein may not be current and Saluda Grade has no obligation to provide any updates or changes. No representation, warranty or undertaking, express or implied, is given as to the accuracy or completeness of the information or opinions contained herein. Certain information contained in these materials has been obtained from published and non-published sources prepared by third parties, which, in certain cases, have not been updated through the date hereof. While such information is believed to be reliable, Saluda Grade has not independently verified such information, nor does it assume any responsibility for the accuracy or completeness of such information. Except as otherwise indicated herein, the information, opinions and estimates provided in this presentation are based on matters and information as they exist as of the date these materials have been prepared and not as of any future date and will not be updated or otherwise revised to reflect information that is subsequently discovered or available, or for changes in circumstances occurring after the date hereof. Saluda Grade’s opinions and estimates constitute Saluda Grade’s judgment and should be regarded as indicative, preliminary and for illustrative purposes only. Certain information contained in this document constitutes forward-looking statements, and there is no representation or guarantee that they will occur.