
What do we know about the people tapping their home equity?
October 14, 2025
Author: Roger Ashworth, Head of Research and Data
Second lien mortgages, both fixed-rate closed-end seconds and home equity lines of credit (HELOCs), play an important role in the US housing market by allowing homeowners to access their equity. TransUnion’s Q2 2025 Home Equity Report(1) estimates that there is currently $21.5 trillion in tappable equity nationwide. This raises the question: what do we know about Americans taking equity out of their homes?
Below we provide a detailed profile of who these borrowers are and what motivations are driving demand. This is based on our review of Home Mortgage Disclosure Act (HMDA) data(2) on originations for the full year 2024.
Borrower and Property Profile
- Second lien borrowers tend to be older: Over half of new originations are to borrowers aged 45 years and older (Figure 1). This aligns with Federal Reserve data(3) showing that older cohorts have higher average net worth and income (Figure 2), enabling them to support larger equity-backed borrowing.
- Second lien borrowers generally have higher credit scores: According to TransUnion, $15.9 trillion of the $21.5 trillion of tappable home equity is held by the highest credit quality homeowners. Consistent with this, second lien originations are skewed toward prime and super-prime borrowers. For example, the average credit score of Saluda Grade’s 2025 second lien loans is 745.
- Most second lien borrowers take home equity out of their primary residence: In our HMDA sample, 97.6% of 2024 private market originations were tied to primary residences. We believe that owner-occupancy correlates with stronger credit performance, especially during periods of economic stress.
- Second lien borrowers maintain higher levels of home equity, even after tapping into it: Second liens are concentrated among borrowers with lower combined loan-to-value (CLTV) ratios relative to first-lien loans (Figure 3). These equity cushions can provide structural protection against both borrower default and potential loss severity.
Figure 1: Second Lien Borrowers Tend to be Older
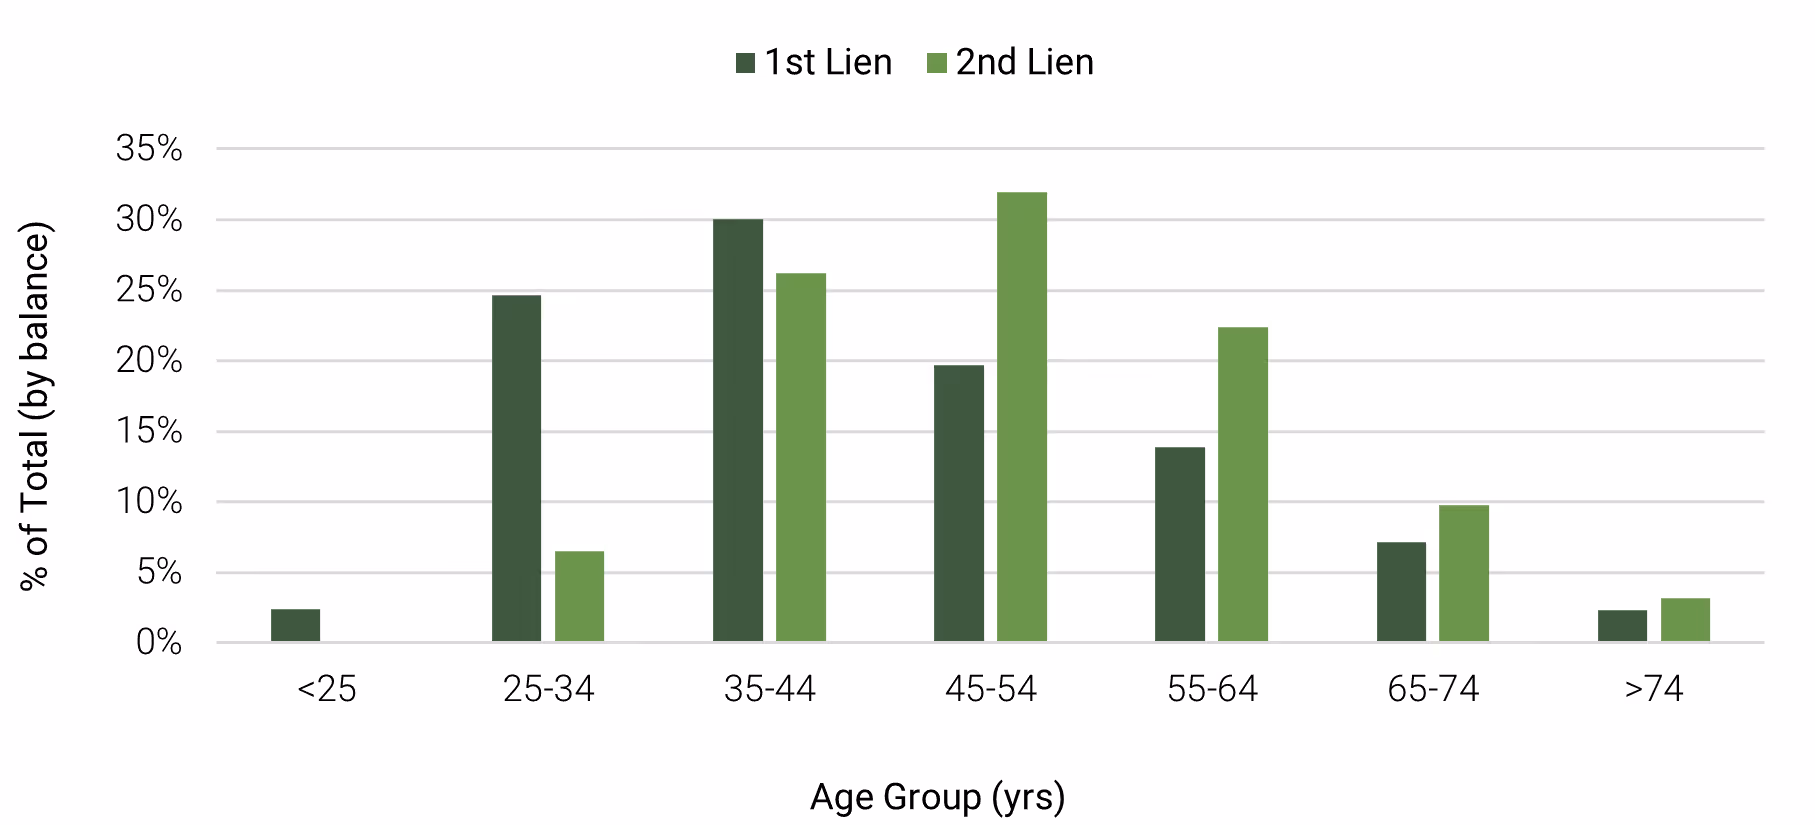
Source: 2024 Home Mortgage Disclosure Act
Figure 2: Average Net Worth and Average Before-Tax Income by Age Group
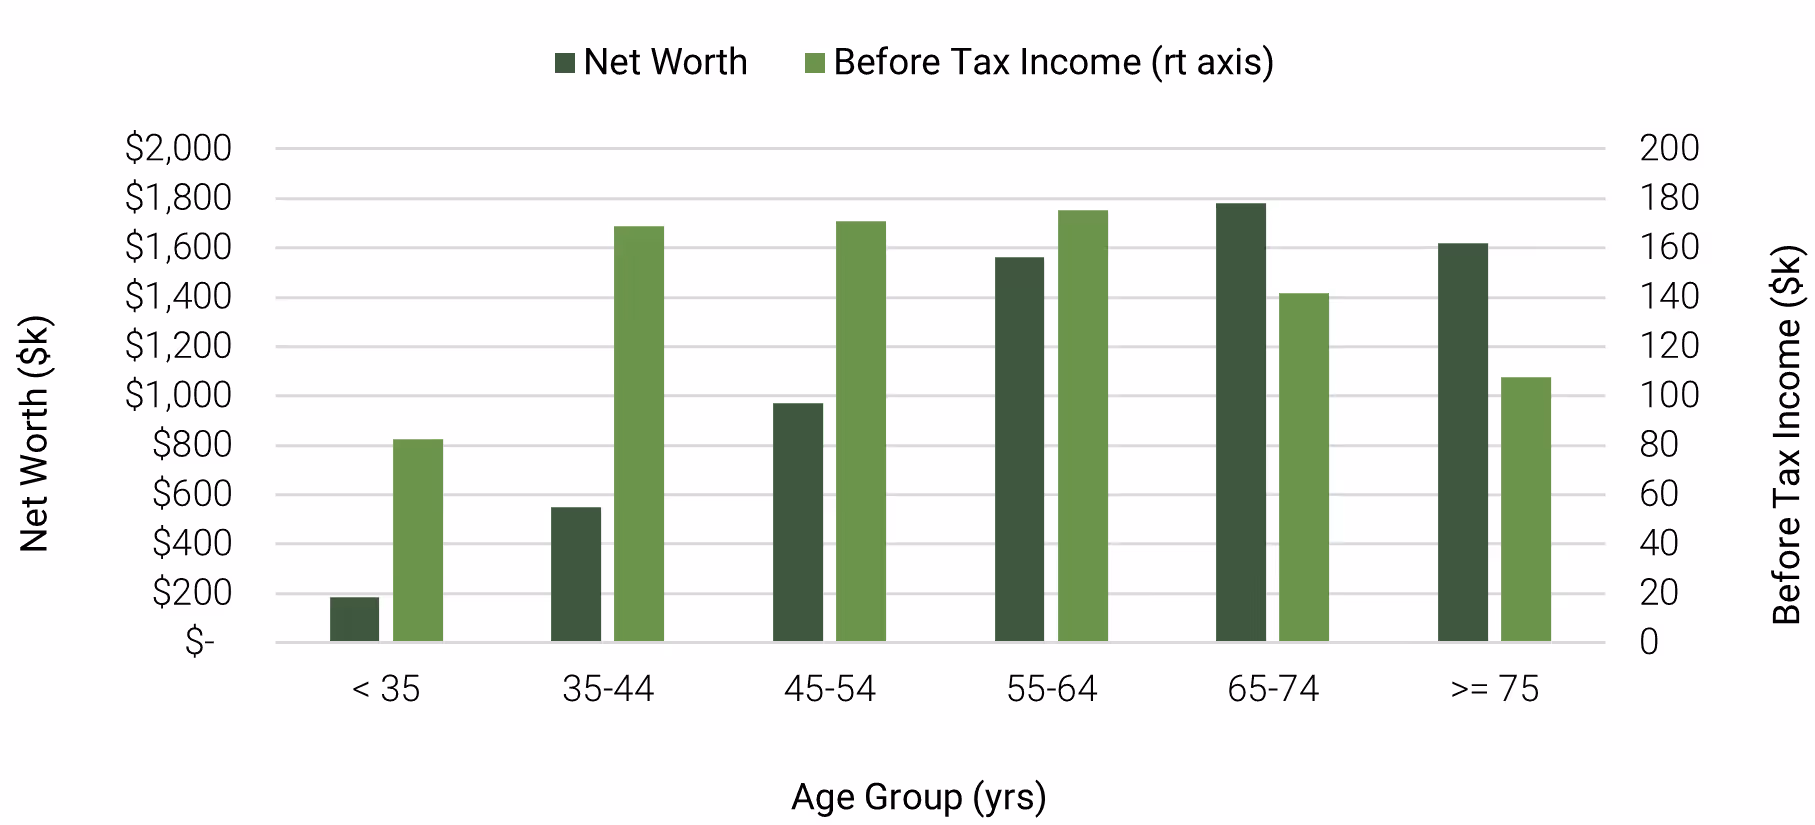
Source: 2022 Federal Reserve Survey of Consumer Finances
Figure 3: Second Lien Borrowers Tend to Have More Home Equity
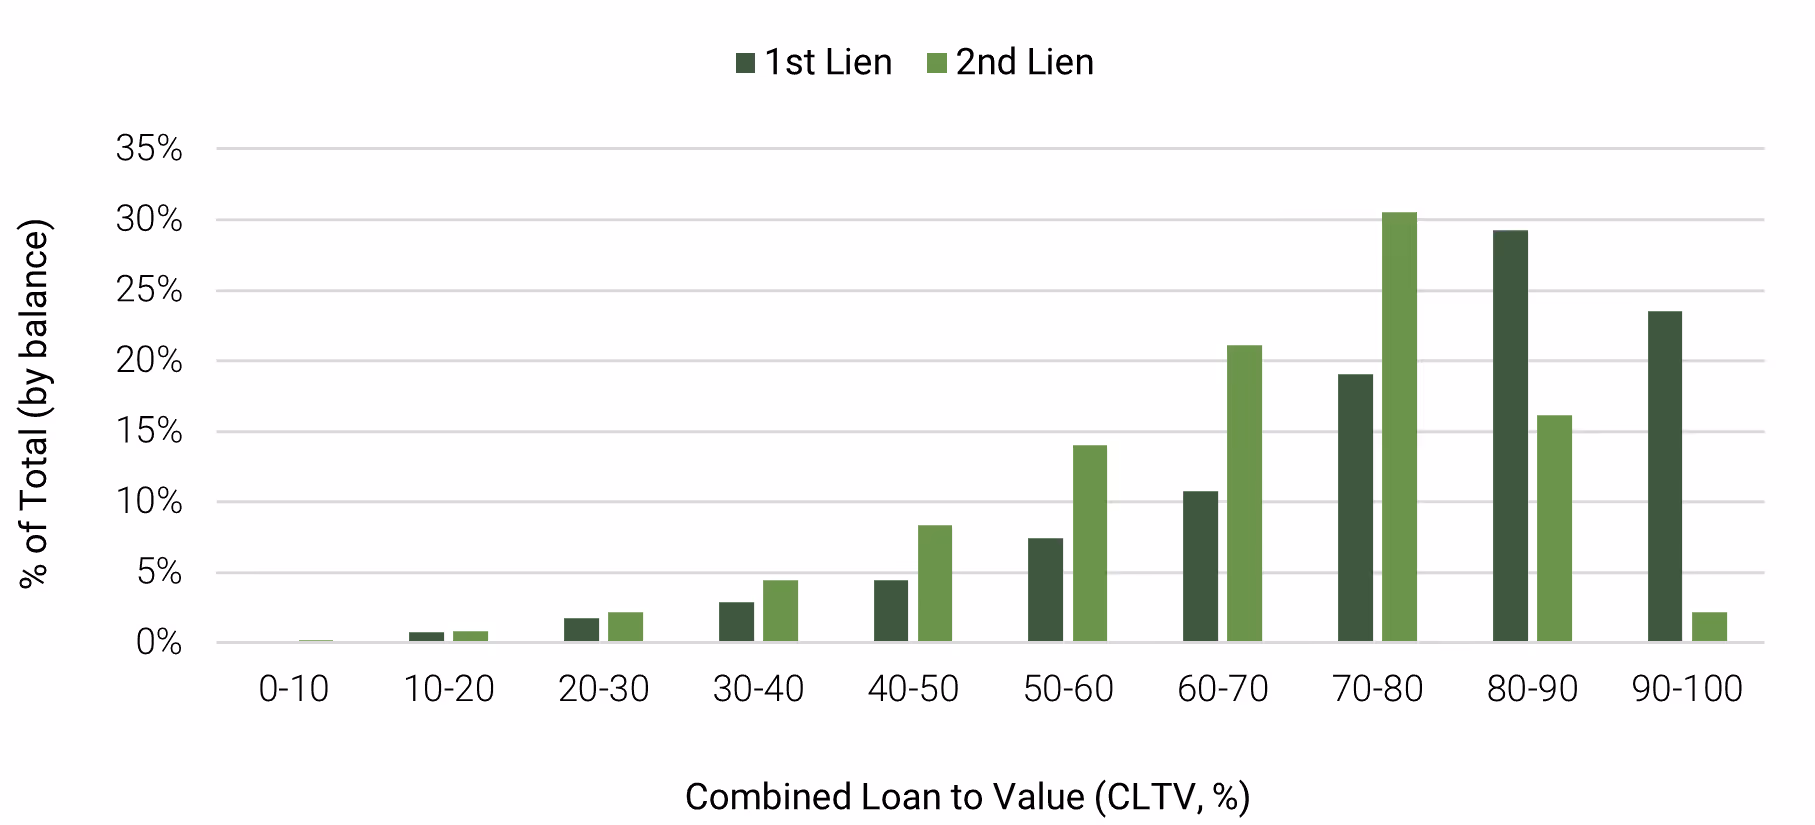
Source: 2024 Home Mortgage Disclosure Act
Product Characteristics
- HELOCs are the preferred method of tapping equity: Roughly three-quarters of second lien products are open-end (HELOCs) compared to closed-end. We presume borrowers are attracted to HELOCs because they provide ongoing access to credit, interest accrual only on drawn amounts, and the ability to manage liquidity over time. HELOCs have traditionally been originated to higher-credit borrowers and are often paired with prime first mortgages, usually taken out years after the initial purchase.
- Private Capital Market Share is Growing: Growth of second lien origination is starting to be driven by non-bank lenders, with 57% of closed-end loan originations falling to non-depositories, up from 23% in Q1 2019 (TransUnion Q2 2025 Home Equity Report). While credit unions and banks still originate the majority of HELOCs, private capital’s market share has grown 1% to 10% over the same time period.
Borrower Motivations
- Most home equity is used to reinvest in the property itself: The majority of second lien borrowing is directed toward home improvement and refinancing (Figure 4). These uses suggest borrowers are either reinvesting in their properties (i.e. adding even more equity to their home) or restructuring obligations without disturbing favorable first-lien mortgage terms.
- Cost savings could be a motivation: We presume that the large share in “other,” is used for debt consolidation, a common purpose we see in our own second lien mortgage originations. According to Bankrate(4), HELOCs currently carry interest rates around 8.24%, which is well below average unsecured personal loans (~12.37%) or credit cards (~20.12%) rates. Additionally, HELOC credit limites are often larger than credit card balances, enabling borrowers to restructure liabilities and reduce household burden.
- Liquidity optionality: The predominance of HELOCs indicates demand not just for immediate borrowing, but also for liquidity optionality. Maintaining a line of credit against home equity provides households with a financial buffer, even if they do not fully utilize the facility.
Figure 4: Primary Use for Second Liens
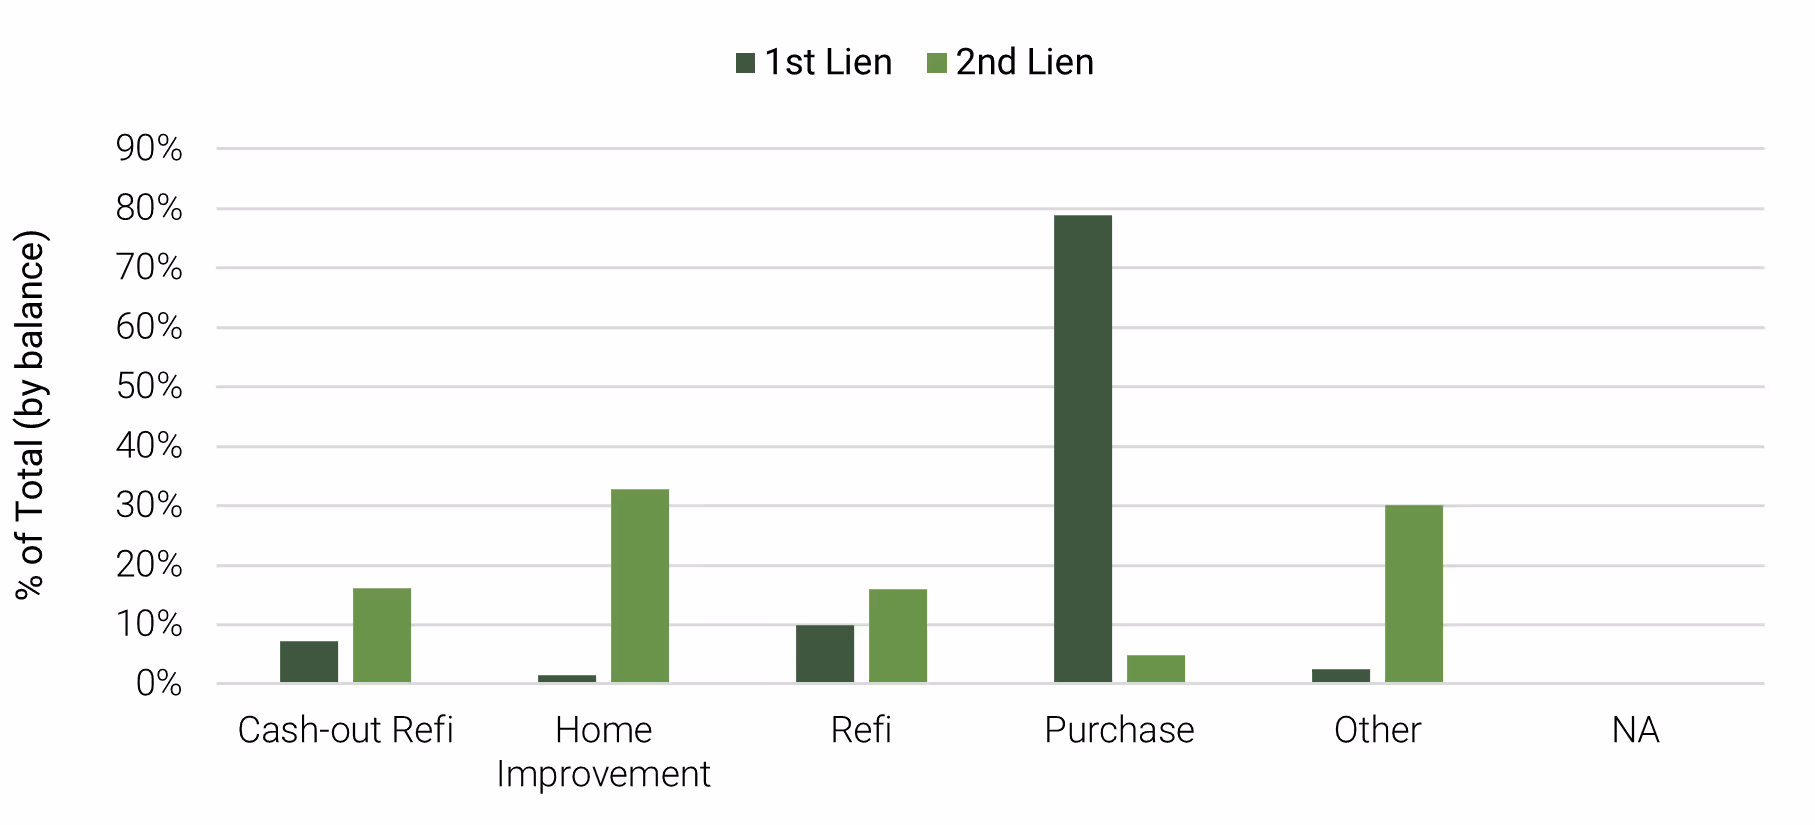
Source: 2024 Home Mortgage Disclosure Act
Income Related to Second Lien Borrowing
- State-level analysis shows that higher-income jurisdictions—such as California and New York—also record some of the highest levels of second lien origination (Figure 5). This overlap reflects that borrowers in these markets typically have higher income.
Figure 5: Second Lien Originations and Median Household Income
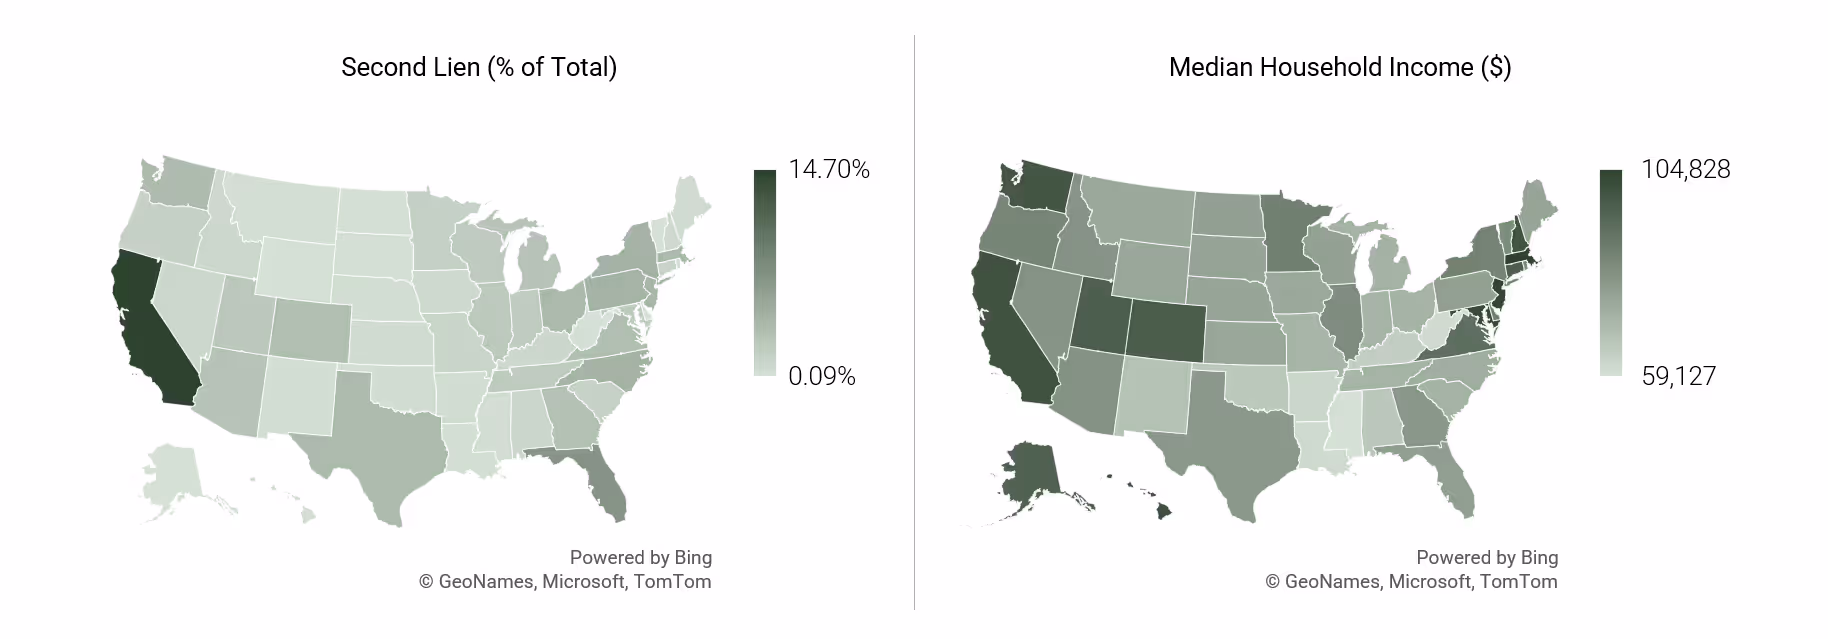
Source: 2024 Home Mortgage Disclosure Act, US Census 2024 Income in the United States.
Footnotes
- TransUnion, Home Equity Trends Report, Q2 2025.
- 2024 Home Mortgage Disclosure Act data, CFPB, Saluda Grade. Sampling of 2024 mortgage origination HMDA data that includes originated loans which are non-business purpose, are not reverse mortgages, are 1-4 family properties, and whose purchaser was a private securitizer.
- 2022 Federal Reserve Survey of Consumer Finances.
- Bankrate Data Center, as of September 1, 2025. The data combines rate tracking insights across decades with consumer sentiment from their proprietary surveys.
Disclaimer
These materials discuss general market activity, industry or sector trends, or other broad-based economic, market or political conditions and should not be construed as research or investment advice. Recipients are urged to consult with their financial advisors before buying or selling any securities. The information included herein may not be current and Saluda Grade has no obligation to provide any updates or changes. No representation, warranty or undertaking, express or implied, is given as to the accuracy or completeness of the information or opinions contained herein. Certain information contained in these materials has been obtained from published and non-published sources prepared by third parties, which, in certain cases, have not been updated through the date hereof. While such information is believed to be reliable, Saluda Grade has not independently verified such information, nor does it assume any responsibility for the accuracy or completeness of such information. Except as otherwise indicated herein, the information, opinions and estimates provided in this presentation are based on matters and information as they exist as of the date these materials have been prepared and not as of any future date and will not be updated or otherwise revised to reflect information that is subsequently discovered or available, or for changes in circumstances occurring after the date hereof. Saluda Grade’s opinions and estimates constitute Saluda Grade’s judgment and should be regarded as indicative, preliminary and for illustrative purposes only. Certain information contained in this document constitutes forward-looking statements, and there is no representation or guarantee that they will occur.